Immigrants from Singapore vs Fijian Female Disability
COMPARE
Immigrants from Singapore
Fijian
Female Disability
Female Disability Comparison
Immigrants from Singapore
Fijians
10.4%
FEMALE DISABILITY
100.0/ 100
METRIC RATING
7th/ 347
METRIC RANK
13.1%
FEMALE DISABILITY
0.0/ 100
METRIC RATING
286th/ 347
METRIC RANK
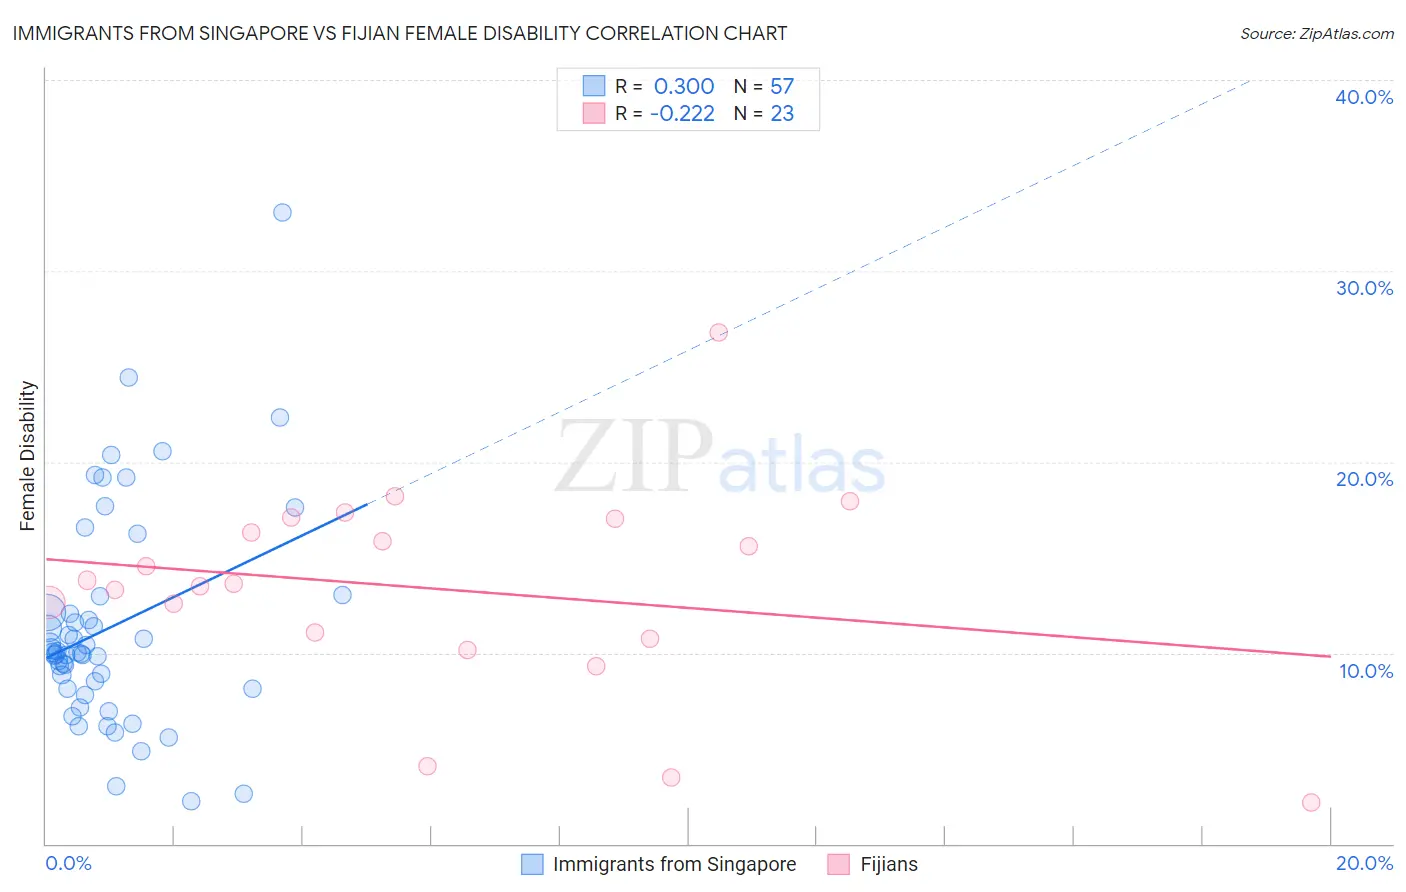
Immigrants from Singapore vs Fijian Female Disability Correlation Chart
The statistical analysis conducted on geographies consisting of 137,521,534 people shows a weak positive correlation between the proportion of Immigrants from Singapore and percentage of females with a disability in the United States with a correlation coefficient (R) of 0.300 and weighted average of 10.4%. Similarly, the statistical analysis conducted on geographies consisting of 55,947,462 people shows a weak negative correlation between the proportion of Fijians and percentage of females with a disability in the United States with a correlation coefficient (R) of -0.222 and weighted average of 13.1%, a difference of 25.6%.
Female Disability Correlation Summary
| Measurement | Immigrants from Singapore | Fijian |
| Minimum | 2.2% | 2.2% |
| Maximum | 33.0% | 26.8% |
| Range | 30.8% | 24.6% |
| Mean | 11.4% | 13.4% |
| Median | 10.0% | 13.6% |
| Interquartile 25% (IQ1) | 8.1% | 10.8% |
| Interquartile 75% (IQ3) | 12.6% | 17.0% |
| Interquartile Range (IQR) | 4.4% | 6.3% |
| Standard Deviation (Sample) | 5.7% | 5.4% |
| Standard Deviation (Population) | 5.6% | 5.3% |
Similar Demographics by Female Disability
Demographics Similar to Immigrants from Singapore by Female Disability
In terms of female disability, the demographic groups most similar to Immigrants from Singapore are Immigrants from South Central Asia (10.5%, a difference of 0.22%), Bolivian (10.4%, a difference of 0.78%), Iranian (10.6%, a difference of 1.1%), Immigrants from Bolivia (10.3%, a difference of 1.7%), and Immigrants from Hong Kong (10.6%, a difference of 1.8%).
| Demographics | Rating | Rank | Female Disability |
| Immigrants | India | 100.0 /100 | #1 | Exceptional 10.0% |
| Filipinos | 100.0 /100 | #2 | Exceptional 10.1% |
| Immigrants | Taiwan | 100.0 /100 | #3 | Exceptional 10.1% |
| Thais | 100.0 /100 | #4 | Exceptional 10.2% |
| Immigrants | Bolivia | 100.0 /100 | #5 | Exceptional 10.3% |
| Bolivians | 100.0 /100 | #6 | Exceptional 10.4% |
| Immigrants | Singapore | 100.0 /100 | #7 | Exceptional 10.4% |
| Immigrants | South Central Asia | 100.0 /100 | #8 | Exceptional 10.5% |
| Iranians | 100.0 /100 | #9 | Exceptional 10.6% |
| Immigrants | Hong Kong | 100.0 /100 | #10 | Exceptional 10.6% |
| Immigrants | Korea | 100.0 /100 | #11 | Exceptional 10.6% |
| Immigrants | Israel | 100.0 /100 | #12 | Exceptional 10.7% |
| Immigrants | Eastern Asia | 100.0 /100 | #13 | Exceptional 10.7% |
| Immigrants | China | 100.0 /100 | #14 | Exceptional 10.7% |
| Burmese | 100.0 /100 | #15 | Exceptional 10.7% |
Demographics Similar to Fijians by Female Disability
In terms of female disability, the demographic groups most similar to Fijians are Bangladeshi (13.1%, a difference of 0.050%), Hmong (13.1%, a difference of 0.10%), English (13.1%, a difference of 0.23%), Welsh (13.1%, a difference of 0.24%), and U.S. Virgin Islander (13.1%, a difference of 0.32%).
| Demographics | Rating | Rank | Female Disability |
| Arapaho | 0.1 /100 | #279 | Tragic 13.0% |
| Irish | 0.1 /100 | #280 | Tragic 13.1% |
| U.S. Virgin Islanders | 0.1 /100 | #281 | Tragic 13.1% |
| Welsh | 0.0 /100 | #282 | Tragic 13.1% |
| English | 0.0 /100 | #283 | Tragic 13.1% |
| Hmong | 0.0 /100 | #284 | Tragic 13.1% |
| Bangladeshis | 0.0 /100 | #285 | Tragic 13.1% |
| Fijians | 0.0 /100 | #286 | Tragic 13.1% |
| Yaqui | 0.0 /100 | #287 | Tragic 13.2% |
| Whites/Caucasians | 0.0 /100 | #288 | Tragic 13.2% |
| Tlingit-Haida | 0.0 /100 | #289 | Tragic 13.2% |
| Immigrants | Yemen | 0.0 /100 | #290 | Tragic 13.2% |
| Shoshone | 0.0 /100 | #291 | Tragic 13.2% |
| Yakama | 0.0 /100 | #292 | Tragic 13.2% |
| Marshallese | 0.0 /100 | #293 | Tragic 13.3% |