Immigrants from Senegal vs Immigrants from Zaire Disability Age Under 5

COMPARE

Immigrants from Senegal
Race
Ancestry
AfghanAfricanAlaska NativeAlaskan AthabascanAlbanianAleutAlsatianAmericanApacheArabArapahoArgentineanArmenianAssyrian/Chaldean/SyriacAustralianAustrianBahamianBangladeshiBarbadianBasqueBelgianBelizeanBermudanBhutaneseBlackfeetBolivianBrazilianBritishBritish West IndianBulgarianBurmeseCajunCambodianCanadianCape VerdeanCarpatho RusynCelticCentral AmericanCentral American IndianCherokeeCheyenneChickasawChileanChineseChippewaChoctawColombianColvilleComancheCosta RicanCreeCreekCroatianCrowCubanCypriotCzechCzechoslovakianDanishDelawareDominicanDutchDutch West IndianEastern EuropeanEcuadorianEgyptianEnglishEstonianEthiopianEuropeanFijianFilipinoFinnishFrenchFrench American IndianFrench CanadianGermanGerman RussianGhanaianGreekGuamanian/ChamorroGuatemalanGuyaneseHaitianHmongHonduranHopiHoumaHungarianIcelanderIndian (Asian)IndonesianInupiatIranianIraqiIrishIroquoisIsraeliItalianJamaicanJapaneseJordanianKenyanKiowaKoreanLaotianLatvianLebaneseLiberianLithuanianLumbeeLuxembourgerMacedonianMalaysianMalteseMarshalleseMenomineeMexicanMexican American IndianMongolianMoroccanNative HawaiianNavajoNepaleseNew ZealanderNicaraguanNigerianNorthern EuropeanNorwegianOkinawanOsageOttawaPaiutePakistaniPalestinianPanamanianParaguayanPennsylvania GermanPeruvianPimaPolishPortuguesePotawatomiPuebloPuerto RicanPuget Sound SalishRomanianRussianSalvadoranSamoanScandinavianScotch-IrishScottishSeminoleSenegaleseSerbianShoshoneSierra LeoneanSiouxSlavicSlovakSloveneSomaliSouth AfricanSouth AmericanSouth American IndianSoviet UnionSpaniardSpanishSpanish AmericanSpanish American IndianSri LankanSubsaharan AfricanSudaneseSwedishSwissSyrianTaiwaneseThaiTlingit-HaidaTohono O'OdhamTonganTrinidadian and TobagonianTsimshianTurkishU.S. Virgin IslanderUgandanUkrainianUruguayanUteVenezuelanVietnameseWelshWest IndianYakamaYaquiYugoslavianYumanYup'ikZimbabwean
Immigration
NonimmigrantsImmigrantsAfghanistanAfricaAlbaniaArgentinaArmeniaAsiaAustraliaAustriaBahamasBangladeshBarbadosBelarusBelgiumBelizeBoliviaBosnia and HerzegovinaBrazilBulgariaBurma/MyanmarCabo VerdeCambodiaCameroonCanadaCaribbeanCentral AmericaChileChinaColombiaCongoCosta RicaCroatiaCubaCzechoslovakiaDenmarkDominicaDominican RepublicEastern AfricaEastern AsiaEastern EuropeEcuadorEgyptEl SalvadorEnglandEritreaEthiopiaEuropeFijiFranceGermanyGhanaGreeceGrenadaGuatemalaGuyanaHaitiHondurasHong KongHungaryIndiaIndonesiaIranIraqIrelandIsraelItalyJamaicaJapanJordanKazakhstanKenyaKoreaKuwaitLaosLatin AmericaLatviaLebanonLiberiaLithuaniaMalaysiaMexicoMicronesiaMiddle AfricaMoldovaMoroccoNepalNetherlandsNicaraguaNigeriaNorth AmericaNorth MacedoniaNorthern AfricaNorthern EuropeNorwayOceaniaPakistanPanamaPeruPhilippinesPolandPortugalRomaniaRussiaSaudi ArabiaScotlandSenegalSerbiaSierra LeoneSingaporeSomaliaSouth AfricaSouth AmericaSouth Central AsiaSouth Eastern AsiaSouthern EuropeSpainSri LankaSt. Vincent and the GrenadinesSudanSwedenSwitzerlandSyriaTaiwanThailandTrinidad and TobagoTurkeyUgandaUkraineUruguayUzbekistanVenezuelaVietnamWest IndiesWestern AfricaWestern AsiaWestern EuropeYemenZimbabweAzores
Immigrants from Zaire
Race
Ancestry
AfghanAfricanAlaska NativeAlaskan AthabascanAlbanianAleutAlsatianAmericanApacheArabArapahoArgentineanArmenianAssyrian/Chaldean/SyriacAustralianAustrianBahamianBangladeshiBarbadianBasqueBelgianBelizeanBermudanBhutaneseBlackfeetBolivianBrazilianBritishBritish West IndianBulgarianBurmeseCajunCambodianCanadianCape VerdeanCarpatho RusynCelticCentral AmericanCentral American IndianCherokeeCheyenneChickasawChileanChineseChippewaChoctawColombianColvilleComancheCosta RicanCreeCreekCroatianCrowCubanCypriotCzechCzechoslovakianDanishDelawareDominicanDutchDutch West IndianEastern EuropeanEcuadorianEgyptianEnglishEstonianEthiopianEuropeanFijianFilipinoFinnishFrenchFrench American IndianFrench CanadianGermanGerman RussianGhanaianGreekGuamanian/ChamorroGuatemalanGuyaneseHaitianHmongHonduranHopiHoumaHungarianIcelanderIndian (Asian)IndonesianInupiatIranianIraqiIrishIroquoisIsraeliItalianJamaicanJapaneseJordanianKenyanKiowaKoreanLaotianLatvianLebaneseLiberianLithuanianLumbeeLuxembourgerMacedonianMalaysianMalteseMarshalleseMenomineeMexicanMexican American IndianMongolianMoroccanNative HawaiianNavajoNepaleseNew ZealanderNicaraguanNigerianNorthern EuropeanNorwegianOkinawanOsageOttawaPaiutePakistaniPalestinianPanamanianParaguayanPennsylvania GermanPeruvianPimaPolishPortuguesePotawatomiPuebloPuerto RicanPuget Sound SalishRomanianRussianSalvadoranSamoanScandinavianScotch-IrishScottishSeminoleSenegaleseSerbianShoshoneSierra LeoneanSiouxSlavicSlovakSloveneSomaliSouth AfricanSouth AmericanSouth American IndianSoviet UnionSpaniardSpanishSpanish AmericanSpanish American IndianSri LankanSubsaharan AfricanSudaneseSwedishSwissSyrianTaiwaneseThaiTlingit-HaidaTohono O'OdhamTonganTrinidadian and TobagonianTsimshianTurkishU.S. Virgin IslanderUgandanUkrainianUruguayanUteVenezuelanVietnameseWelshWest IndianYakamaYaquiYugoslavianYumanYup'ikZimbabwean
Immigration
NonimmigrantsImmigrantsAfghanistanAfricaAlbaniaArgentinaArmeniaAsiaAustraliaAustriaBahamasBangladeshBarbadosBelarusBelgiumBelizeBoliviaBosnia and HerzegovinaBrazilBulgariaBurma/MyanmarCabo VerdeCambodiaCameroonCanadaCaribbeanCentral AmericaChileChinaColombiaCongoCosta RicaCroatiaCubaCzechoslovakiaDenmarkDominicaDominican RepublicEastern AfricaEastern AsiaEastern EuropeEcuadorEgyptEl SalvadorEnglandEritreaEthiopiaEuropeFijiFranceGermanyGhanaGreeceGrenadaGuatemalaGuyanaHaitiHondurasHong KongHungaryIndiaIndonesiaIranIraqIrelandIsraelItalyJamaicaJapanJordanKazakhstanKenyaKoreaKuwaitLaosLatin AmericaLatviaLebanonLiberiaLithuaniaMalaysiaMexicoMicronesiaMiddle AfricaMoldovaMoroccoNepalNetherlandsNicaraguaNigeriaNorth AmericaNorth MacedoniaNorthern AfricaNorthern EuropeNorwayOceaniaPakistanPanamaPeruPhilippinesPolandPortugalRomaniaRussiaSaudi ArabiaScotlandSerbiaSierra LeoneSingaporeSomaliaSouth AfricaSouth AmericaSouth Central AsiaSouth Eastern AsiaSouthern EuropeSpainSri LankaSt. Vincent and the GrenadinesSudanSwedenSwitzerlandSyriaTaiwanThailandTrinidad and TobagoTurkeyUgandaUkraineUruguayUzbekistanVenezuelaVietnamWest IndiesWestern AfricaWestern AsiaWestern EuropeYemenZaireZimbabweAzores
Disability Age Under 5
Income
Poverty
Unemployment
Labor Participation
Family Structure
Vehicle Availability
Education Level
Disability

Disability Age Under 5 Comparison

Immigrants from Senegal

Immigrants from Zaire

Exceptional
Exceptional
1.2%
DISABILITY AGE UNDER 5
91.4/ 100
METRIC RATING
121st/ 347
METRIC RANK
1.1%
DISABILITY AGE UNDER 5
97.8/ 100
METRIC RATING
84th/ 347
METRIC RANK

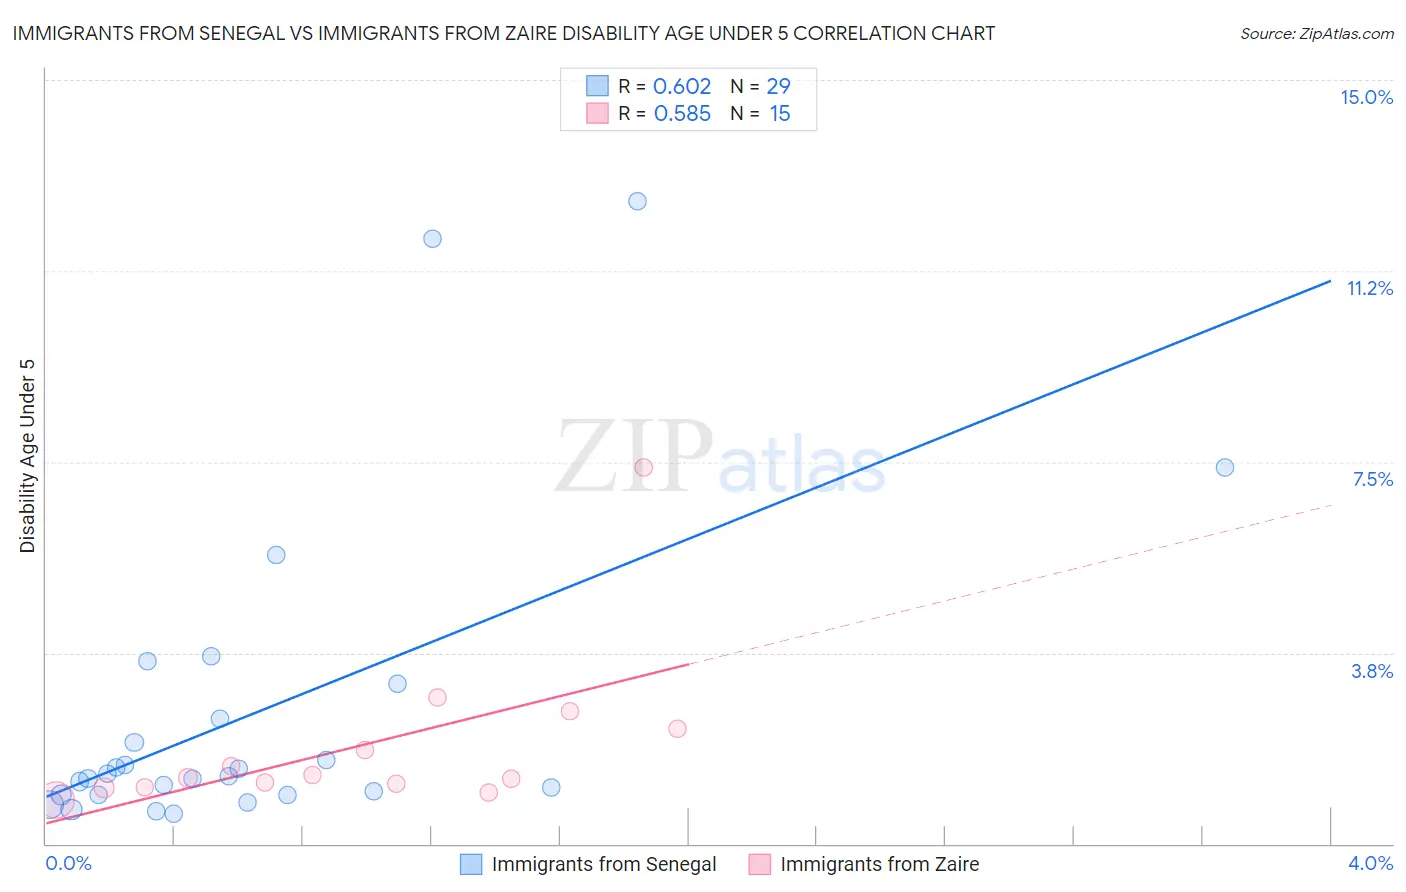
Immigrants from Senegal vs Immigrants from Zaire Disability Age Under 5 Correlation Chart

The statistical analysis conducted on geographies consisting of 70,932,249 people shows a significant positive correlation between the proportion of Immigrants from Senegal and percentage of population with a disability under the age of 5 in the United States with a correlation coefficient (R) of 0.602 and weighted average of 1.2%. Similarly, the statistical analysis conducted on geographies consisting of 82,804,930 people shows a substantial positive correlation between the proportion of Immigrants from Zaire and percentage of population with a disability under the age of 5 in the United States with a correlation coefficient (R) of 0.585 and weighted average of 1.1%, a difference of 3.5%.
Immigrants from Senegal vs Immigrants from Zaire Disability Age Under 5

Disability Age Under 5 Correlation Summary

MeasurementImmigrants from SenegalImmigrants from Zaire
Minimum0.59%0.85%
Maximum12.6%7.4%
Range12.0%6.5%
Mean2.6%1.9%
Median1.3%1.3%
Interquartile 25% (IQ1)0.96%1.1%
Interquartile 75% (IQ3)2.8%2.3%
Interquartile Range (IQR)1.8%1.2%
Standard Deviation (Sample)3.1%1.6%
Standard Deviation (Population)3.0%1.6%

Similar Demographics by Disability Age Under 5

Demographics Similar to Immigrants from Senegal by Disability Age Under 5

In terms of disability age under 5, the demographic groups most similar to Immigrants from Senegal are Aleut (1.2%, a difference of 0.19%), Zimbabwean (1.2%, a difference of 0.24%), Immigrants from Cambodia (1.2%, a difference of 0.26%), Immigrants from Eritrea (1.2%, a difference of 0.28%), and Japanese (1.2%, a difference of 0.32%).
DemographicsRating | RankDisability Age Under 5
Belizeans
93.9
/100
|
#114
Exceptional
1.2%
Immigrants | Caribbean
93.8
/100
|
#115
Exceptional
1.2%
Immigrants | Northern Africa
93.8
/100
|
#116
Exceptional
1.2%
Immigrants | Philippines
93.5
/100
|
#117
Exceptional
1.2%
Immigrants | Venezuela
93.4
/100
|
#118
Exceptional
1.2%
Bhutanese
92.5
/100
|
#119
Exceptional
1.2%
Immigrants | Eritrea
92.3
/100
|
#120
Exceptional
1.2%
Immigrants | Senegal
91.4
/100
|
#121
Exceptional
1.2%
Aleuts
90.7
/100
|
#122
Exceptional
1.2%
Zimbabweans
90.6
/100
|
#123
Exceptional
1.2%
Immigrants | Cambodia
90.5
/100
|
#124
Exceptional
1.2%
Japanese
90.3
/100
|
#125
Exceptional
1.2%
Central Americans
89.7
/100
|
#126
Excellent
1.2%
Immigrants | Romania
88.4
/100
|
#127
Excellent
1.2%
Immigrants | France
88.4
/100
|
#128
Excellent
1.2%

Demographics Similar to Immigrants from Zaire by Disability Age Under 5

In terms of disability age under 5, the demographic groups most similar to Immigrants from Zaire are Sudanese (1.1%, a difference of 0.080%), Immigrants from Syria (1.1%, a difference of 0.15%), Immigrants from Jordan (1.1%, a difference of 0.16%), Okinawan (1.1%, a difference of 0.20%), and Ugandan (1.1%, a difference of 0.22%).
DemographicsRating | RankDisability Age Under 5
Immigrants | Denmark
98.1
/100
|
#77
Exceptional
1.1%
West Indians
98.0
/100
|
#78
Exceptional
1.1%
Hmong
98.0
/100
|
#79
Exceptional
1.1%
Immigrants | Trinidad and Tobago
98.0
/100
|
#80
Exceptional
1.1%
Turks
98.0
/100
|
#81
Exceptional
1.1%
Immigrants | Jordan
97.9
/100
|
#82
Exceptional
1.1%
Immigrants | Syria
97.9
/100
|
#83
Exceptional
1.1%
Immigrants | Zaire
97.8
/100
|
#84
Exceptional
1.1%
Sudanese
97.7
/100
|
#85
Exceptional
1.1%
Okinawans
97.6
/100
|
#86
Exceptional
1.1%
Ugandans
97.5
/100
|
#87
Exceptional
1.1%
Immigrants | Dominican Republic
97.5
/100
|
#88
Exceptional
1.1%
Ethiopians
97.2
/100
|
#89
Exceptional
1.1%
Chinese
97.2
/100
|
#90
Exceptional
1.1%
Albanians
97.2
/100
|
#91
Exceptional
1.1%