Immigrants from Northern Africa vs Czech Male Disability
COMPARE
Immigrants from Northern Africa
Czech
Male Disability
Male Disability Comparison
Immigrants from Northern Africa
Czechs
10.4%
MALE DISABILITY
99.4/ 100
METRIC RATING
61st/ 347
METRIC RANK
11.9%
MALE DISABILITY
1.1/ 100
METRIC RATING
240th/ 347
METRIC RANK
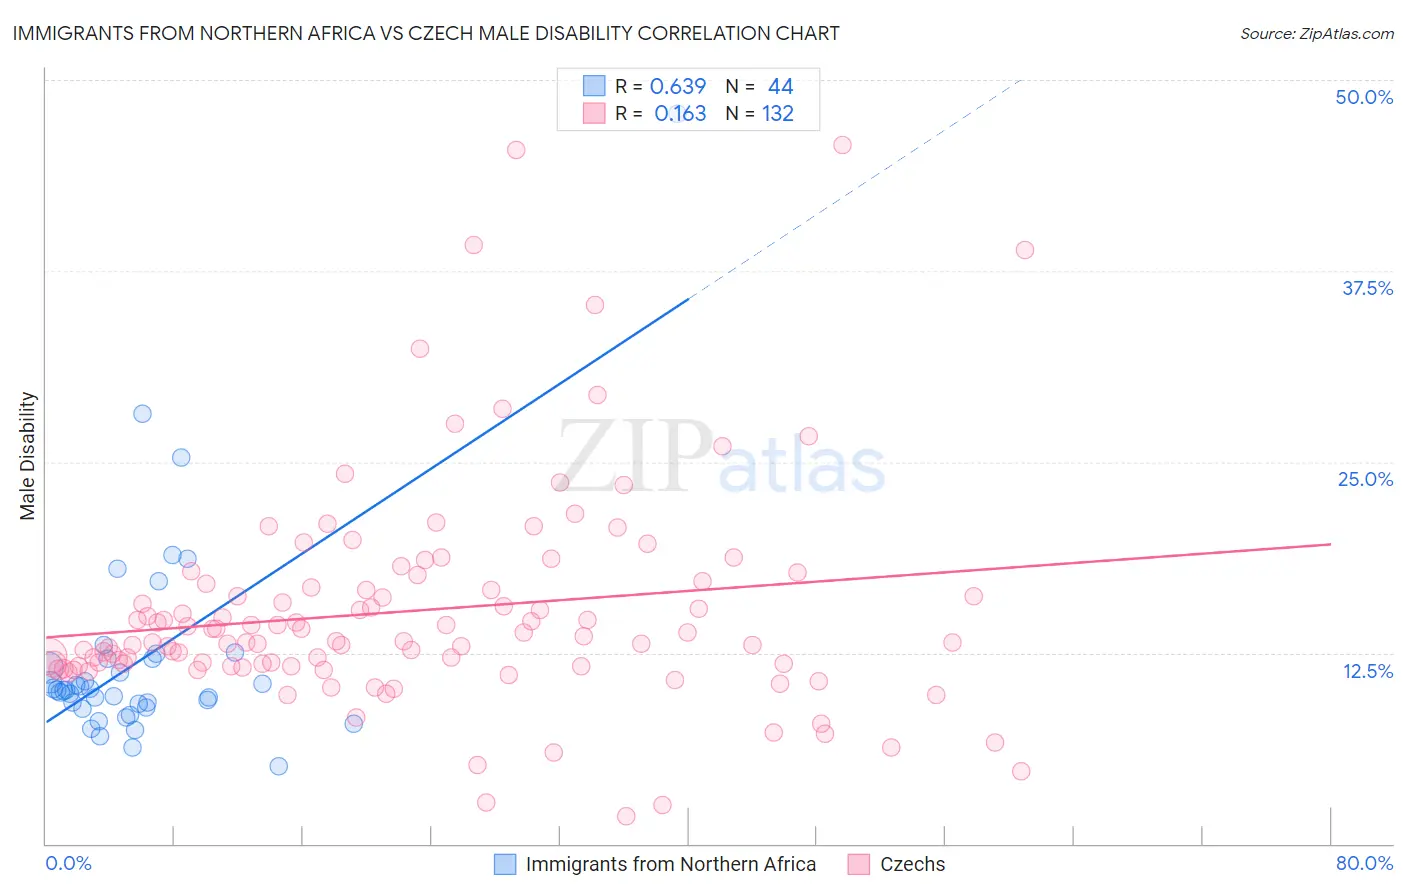
Immigrants from Northern Africa vs Czech Male Disability Correlation Chart
The statistical analysis conducted on geographies consisting of 321,185,016 people shows a significant positive correlation between the proportion of Immigrants from Northern Africa and percentage of males with a disability in the United States with a correlation coefficient (R) of 0.639 and weighted average of 10.4%. Similarly, the statistical analysis conducted on geographies consisting of 484,720,527 people shows a poor positive correlation between the proportion of Czechs and percentage of males with a disability in the United States with a correlation coefficient (R) of 0.163 and weighted average of 11.9%, a difference of 14.4%.
Male Disability Correlation Summary
| Measurement | Immigrants from Northern Africa | Czech |
| Minimum | 5.1% | 1.8% |
| Maximum | 47.8% | 45.8% |
| Range | 42.7% | 44.0% |
| Mean | 12.1% | 15.3% |
| Median | 10.0% | 13.3% |
| Interquartile 25% (IQ1) | 9.0% | 11.6% |
| Interquartile 75% (IQ3) | 12.1% | 16.9% |
| Interquartile Range (IQR) | 3.1% | 5.3% |
| Standard Deviation (Sample) | 7.1% | 7.2% |
| Standard Deviation (Population) | 7.1% | 7.2% |
Similar Demographics by Male Disability
Demographics Similar to Immigrants from Northern Africa by Male Disability
In terms of male disability, the demographic groups most similar to Immigrants from Northern Africa are Immigrants from Colombia (10.4%, a difference of 0.090%), Immigrants from Australia (10.4%, a difference of 0.15%), Immigrants from Ecuador (10.4%, a difference of 0.26%), Immigrants from Belarus (10.4%, a difference of 0.29%), and Immigrants from Japan (10.4%, a difference of 0.30%).
| Demographics | Rating | Rank | Male Disability |
| Peruvians | 99.6 /100 | #54 | Exceptional 10.4% |
| Immigrants | Eritrea | 99.6 /100 | #55 | Exceptional 10.4% |
| Tongans | 99.6 /100 | #56 | Exceptional 10.4% |
| Immigrants | South America | 99.6 /100 | #57 | Exceptional 10.4% |
| Immigrants | Japan | 99.5 /100 | #58 | Exceptional 10.4% |
| Immigrants | Australia | 99.5 /100 | #59 | Exceptional 10.4% |
| Immigrants | Colombia | 99.5 /100 | #60 | Exceptional 10.4% |
| Immigrants | Northern Africa | 99.4 /100 | #61 | Exceptional 10.4% |
| Immigrants | Ecuador | 99.3 /100 | #62 | Exceptional 10.4% |
| Immigrants | Belarus | 99.3 /100 | #63 | Exceptional 10.4% |
| Jordanians | 99.3 /100 | #64 | Exceptional 10.5% |
| Immigrants | Grenada | 99.2 /100 | #65 | Exceptional 10.5% |
| Guyanese | 99.2 /100 | #66 | Exceptional 10.5% |
| Immigrants | Afghanistan | 99.2 /100 | #67 | Exceptional 10.5% |
| Colombians | 99.2 /100 | #68 | Exceptional 10.5% |
Demographics Similar to Czechs by Male Disability
In terms of male disability, the demographic groups most similar to Czechs are Bahamian (11.9%, a difference of 0.040%), Italian (11.9%, a difference of 0.050%), Northern European (11.9%, a difference of 0.050%), Samoan (11.9%, a difference of 0.080%), and Yugoslavian (11.9%, a difference of 0.10%).
| Demographics | Rating | Rank | Male Disability |
| Mexicans | 1.7 /100 | #233 | Tragic 11.8% |
| Immigrants | Canada | 1.6 /100 | #234 | Tragic 11.9% |
| Immigrants | North America | 1.5 /100 | #235 | Tragic 11.9% |
| U.S. Virgin Islanders | 1.3 /100 | #236 | Tragic 11.9% |
| Carpatho Rusyns | 1.3 /100 | #237 | Tragic 11.9% |
| Yugoslavians | 1.2 /100 | #238 | Tragic 11.9% |
| Italians | 1.2 /100 | #239 | Tragic 11.9% |
| Czechs | 1.1 /100 | #240 | Tragic 11.9% |
| Bahamians | 1.1 /100 | #241 | Tragic 11.9% |
| Northern Europeans | 1.1 /100 | #242 | Tragic 11.9% |
| Samoans | 1.1 /100 | #243 | Tragic 11.9% |
| Immigrants | Laos | 1.0 /100 | #244 | Tragic 11.9% |
| Immigrants | Liberia | 1.0 /100 | #245 | Tragic 11.9% |
| Danes | 0.9 /100 | #246 | Tragic 11.9% |
| Hungarians | 0.8 /100 | #247 | Tragic 12.0% |