Immigrants from Lebanon vs Immigrants from Haiti Disability
COMPARE
Immigrants from Lebanon
Immigrants from Haiti
Disability
Disability Comparison
Immigrants from Lebanon
Immigrants from Haiti
11.0%
DISABILITY
99.4/ 100
METRIC RATING
71st/ 347
METRIC RANK
11.7%
DISABILITY
59.2/ 100
METRIC RATING
162nd/ 347
METRIC RANK
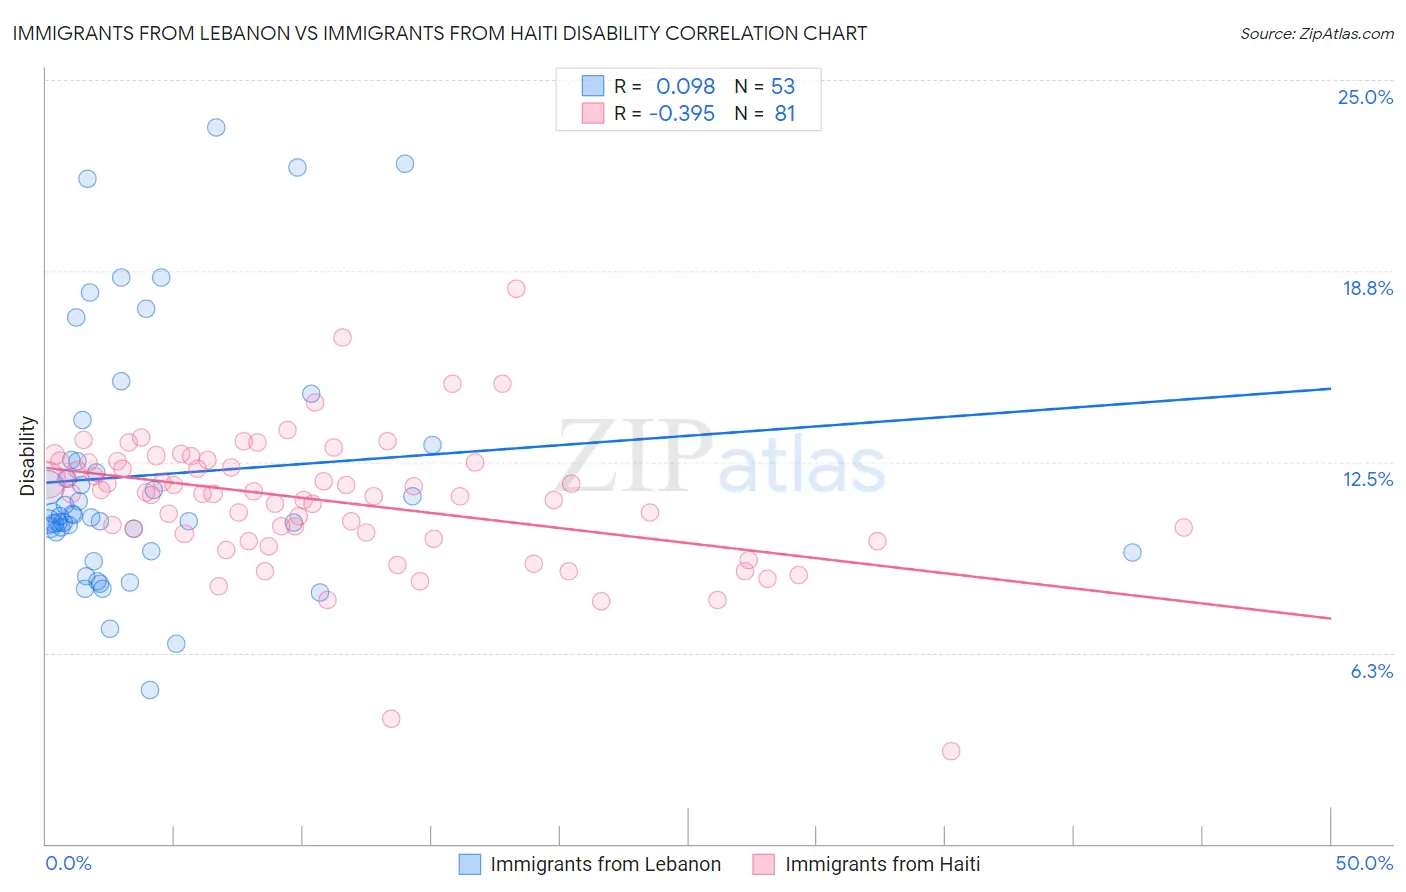
Immigrants from Lebanon vs Immigrants from Haiti Disability Correlation Chart
The statistical analysis conducted on geographies consisting of 217,153,550 people shows a slight positive correlation between the proportion of Immigrants from Lebanon and percentage of population with a disability in the United States with a correlation coefficient (R) of 0.098 and weighted average of 11.0%. Similarly, the statistical analysis conducted on geographies consisting of 225,241,384 people shows a mild negative correlation between the proportion of Immigrants from Haiti and percentage of population with a disability in the United States with a correlation coefficient (R) of -0.395 and weighted average of 11.7%, a difference of 5.6%.
Disability Correlation Summary
| Measurement | Immigrants from Lebanon | Immigrants from Haiti |
| Minimum | 5.1% | 3.0% |
| Maximum | 23.5% | 18.2% |
| Range | 18.4% | 15.2% |
| Mean | 12.1% | 11.2% |
| Median | 10.7% | 11.5% |
| Interquartile 25% (IQ1) | 9.9% | 10.1% |
| Interquartile 75% (IQ3) | 12.8% | 12.5% |
| Interquartile Range (IQR) | 2.9% | 2.4% |
| Standard Deviation (Sample) | 4.1% | 2.2% |
| Standard Deviation (Population) | 4.1% | 2.2% |
Similar Demographics by Disability
Demographics Similar to Immigrants from Lebanon by Disability
In terms of disability, the demographic groups most similar to Immigrants from Lebanon are Immigrants from France (11.0%, a difference of 0.020%), Sri Lankan (11.0%, a difference of 0.090%), Immigrants from Chile (11.0%, a difference of 0.090%), Immigrants from Bangladesh (11.0%, a difference of 0.11%), and Immigrants from Serbia (11.0%, a difference of 0.13%).
| Demographics | Rating | Rank | Disability |
| Immigrants | Sweden | 99.6 /100 | #64 | Exceptional 11.0% |
| Bulgarians | 99.6 /100 | #65 | Exceptional 11.0% |
| Laotians | 99.6 /100 | #66 | Exceptional 11.0% |
| Colombians | 99.6 /100 | #67 | Exceptional 11.0% |
| Immigrants | Afghanistan | 99.6 /100 | #68 | Exceptional 11.0% |
| Sri Lankans | 99.5 /100 | #69 | Exceptional 11.0% |
| Immigrants | France | 99.4 /100 | #70 | Exceptional 11.0% |
| Immigrants | Lebanon | 99.4 /100 | #71 | Exceptional 11.0% |
| Immigrants | Chile | 99.4 /100 | #72 | Exceptional 11.0% |
| Immigrants | Bangladesh | 99.4 /100 | #73 | Exceptional 11.0% |
| Immigrants | Serbia | 99.4 /100 | #74 | Exceptional 11.0% |
| Immigrants | Vietnam | 99.4 /100 | #75 | Exceptional 11.0% |
| Sierra Leoneans | 99.3 /100 | #76 | Exceptional 11.0% |
| Immigrants | Belgium | 99.3 /100 | #77 | Exceptional 11.0% |
| Immigrants | Cameroon | 99.3 /100 | #78 | Exceptional 11.1% |
Demographics Similar to Immigrants from Haiti by Disability
In terms of disability, the demographic groups most similar to Immigrants from Haiti are Immigrants from Trinidad and Tobago (11.7%, a difference of 0.020%), Syrian (11.7%, a difference of 0.030%), Cuban (11.7%, a difference of 0.12%), Immigrants from Cuba (11.6%, a difference of 0.17%), and Pakistani (11.7%, a difference of 0.21%).
| Demographics | Rating | Rank | Disability |
| Immigrants | Netherlands | 69.8 /100 | #155 | Good 11.6% |
| Immigrants | Fiji | 69.5 /100 | #156 | Good 11.6% |
| Immigrants | Middle Africa | 69.5 /100 | #157 | Good 11.6% |
| Armenians | 65.9 /100 | #158 | Good 11.6% |
| Guatemalans | 65.1 /100 | #159 | Good 11.6% |
| Immigrants | Barbados | 64.2 /100 | #160 | Good 11.6% |
| Immigrants | Cuba | 62.8 /100 | #161 | Good 11.6% |
| Immigrants | Haiti | 59.2 /100 | #162 | Average 11.7% |
| Immigrants | Trinidad and Tobago | 58.9 /100 | #163 | Average 11.7% |
| Syrians | 58.5 /100 | #164 | Average 11.7% |
| Cubans | 56.7 /100 | #165 | Average 11.7% |
| Pakistanis | 54.7 /100 | #166 | Average 11.7% |
| Estonians | 54.4 /100 | #167 | Average 11.7% |
| Immigrants | Latin America | 54.1 /100 | #168 | Average 11.7% |
| Immigrants | Austria | 53.4 /100 | #169 | Average 11.7% |