Immigrants from Congo vs Slovak Male Disability
COMPARE
Immigrants from Congo
Slovak
Male Disability
Male Disability Comparison
Immigrants from Congo
Slovaks
11.7%
MALE DISABILITY
3.7/ 100
METRIC RATING
221st/ 347
METRIC RANK
12.7%
MALE DISABILITY
0.0/ 100
METRIC RATING
279th/ 347
METRIC RANK
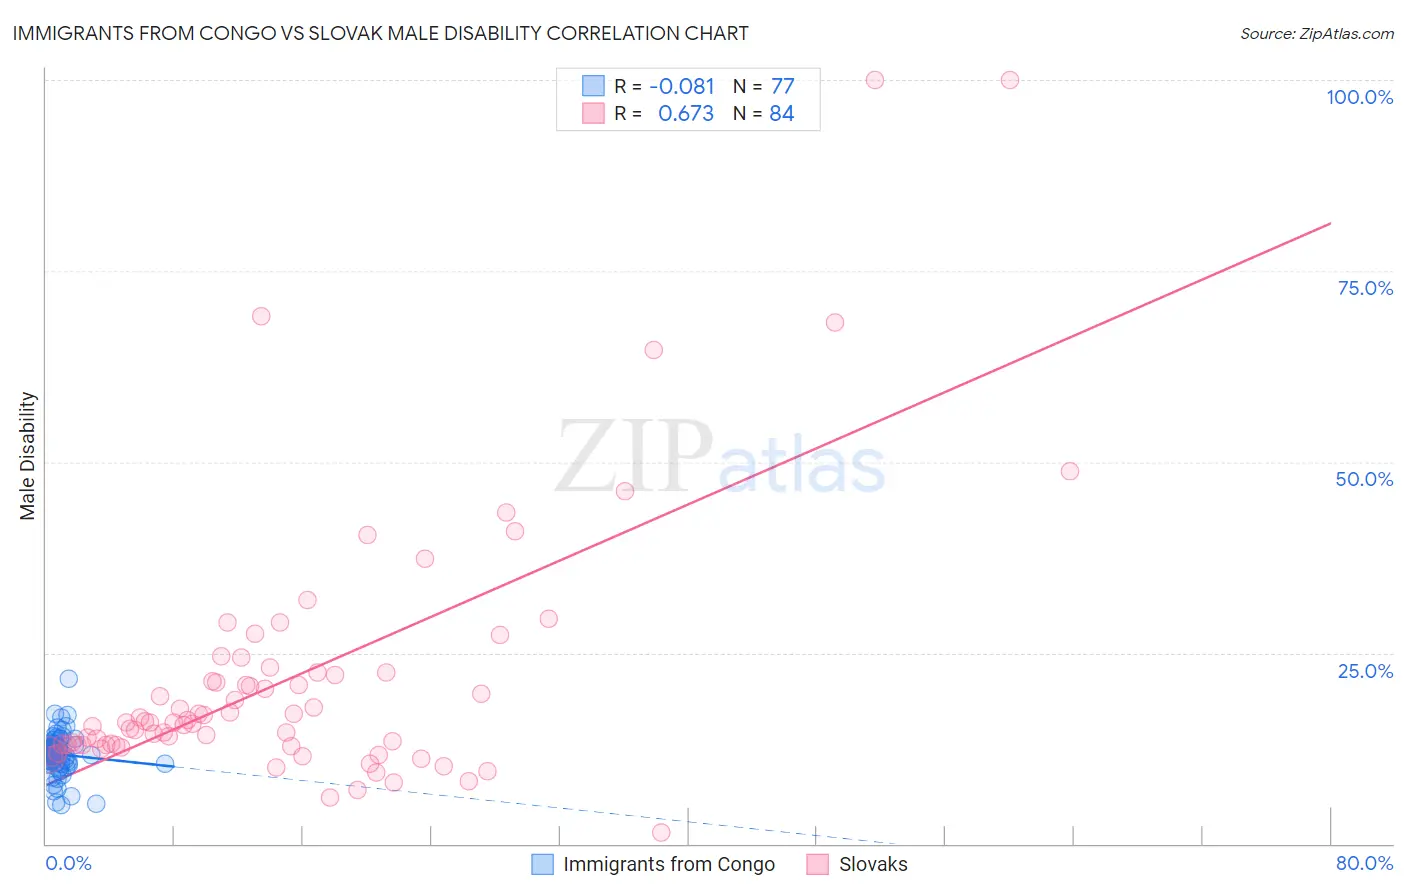
Immigrants from Congo vs Slovak Male Disability Correlation Chart
The statistical analysis conducted on geographies consisting of 92,121,223 people shows a slight negative correlation between the proportion of Immigrants from Congo and percentage of males with a disability in the United States with a correlation coefficient (R) of -0.081 and weighted average of 11.7%. Similarly, the statistical analysis conducted on geographies consisting of 397,843,649 people shows a significant positive correlation between the proportion of Slovaks and percentage of males with a disability in the United States with a correlation coefficient (R) of 0.673 and weighted average of 12.7%, a difference of 8.3%.
Male Disability Correlation Summary
| Measurement | Immigrants from Congo | Slovak |
| Minimum | 5.1% | 1.5% |
| Maximum | 21.7% | 100.0% |
| Range | 16.5% | 98.5% |
| Mean | 11.7% | 21.9% |
| Median | 11.8% | 15.9% |
| Interquartile 25% (IQ1) | 10.6% | 12.9% |
| Interquartile 75% (IQ3) | 12.9% | 22.4% |
| Interquartile Range (IQR) | 2.4% | 9.5% |
| Standard Deviation (Sample) | 2.7% | 17.7% |
| Standard Deviation (Population) | 2.6% | 17.6% |
Similar Demographics by Male Disability
Demographics Similar to Immigrants from Congo by Male Disability
In terms of male disability, the demographic groups most similar to Immigrants from Congo are Immigrants from Western Europe (11.7%, a difference of 0.010%), Panamanian (11.7%, a difference of 0.020%), Immigrants from England (11.7%, a difference of 0.080%), Alsatian (11.7%, a difference of 0.15%), and Immigrants from Bahamas (11.7%, a difference of 0.24%).
| Demographics | Rating | Rank | Male Disability |
| Lithuanians | 6.6 /100 | #214 | Tragic 11.6% |
| Indonesians | 5.9 /100 | #215 | Tragic 11.6% |
| Immigrants | Dominican Republic | 4.9 /100 | #216 | Tragic 11.7% |
| Immigrants | Dominica | 4.6 /100 | #217 | Tragic 11.7% |
| Immigrants | England | 4.0 /100 | #218 | Tragic 11.7% |
| Panamanians | 3.8 /100 | #219 | Tragic 11.7% |
| Immigrants | Western Europe | 3.8 /100 | #220 | Tragic 11.7% |
| Immigrants | Congo | 3.7 /100 | #221 | Tragic 11.7% |
| Alsatians | 3.3 /100 | #222 | Tragic 11.7% |
| Immigrants | Bahamas | 3.2 /100 | #223 | Tragic 11.7% |
| Japanese | 3.1 /100 | #224 | Tragic 11.7% |
| Liberians | 3.1 /100 | #225 | Tragic 11.8% |
| Sub-Saharan Africans | 2.8 /100 | #226 | Tragic 11.8% |
| Austrians | 2.5 /100 | #227 | Tragic 11.8% |
| Hispanics or Latinos | 2.3 /100 | #228 | Tragic 11.8% |
Demographics Similar to Slovaks by Male Disability
In terms of male disability, the demographic groups most similar to Slovaks are Dutch (12.7%, a difference of 0.050%), Sioux (12.7%, a difference of 0.11%), Central American Indian (12.7%, a difference of 0.15%), Irish (12.7%, a difference of 0.16%), and German (12.7%, a difference of 0.17%).
| Demographics | Rating | Rank | Male Disability |
| Hmong | 0.0 /100 | #272 | Tragic 12.5% |
| Native Hawaiians | 0.0 /100 | #273 | Tragic 12.5% |
| Hopi | 0.0 /100 | #274 | Tragic 12.5% |
| Fijians | 0.0 /100 | #275 | Tragic 12.6% |
| Africans | 0.0 /100 | #276 | Tragic 12.6% |
| Finns | 0.0 /100 | #277 | Tragic 12.6% |
| Central American Indians | 0.0 /100 | #278 | Tragic 12.7% |
| Slovaks | 0.0 /100 | #279 | Tragic 12.7% |
| Dutch | 0.0 /100 | #280 | Tragic 12.7% |
| Sioux | 0.0 /100 | #281 | Tragic 12.7% |
| Irish | 0.0 /100 | #282 | Tragic 12.7% |
| Germans | 0.0 /100 | #283 | Tragic 12.7% |
| Spanish | 0.0 /100 | #284 | Tragic 12.7% |
| Welsh | 0.0 /100 | #285 | Tragic 12.7% |
| Scottish | 0.0 /100 | #286 | Tragic 12.8% |