Immigrants from Caribbean vs Immigrants from Cabo Verde Male Disability
COMPARE
Immigrants from Caribbean
Immigrants from Cabo Verde
Male Disability
Male Disability Comparison
Immigrants from Caribbean
Immigrants from Cabo Verde
11.3%
MALE DISABILITY
41.4/ 100
METRIC RATING
179th/ 347
METRIC RANK
12.8%
MALE DISABILITY
0.0/ 100
METRIC RATING
289th/ 347
METRIC RANK
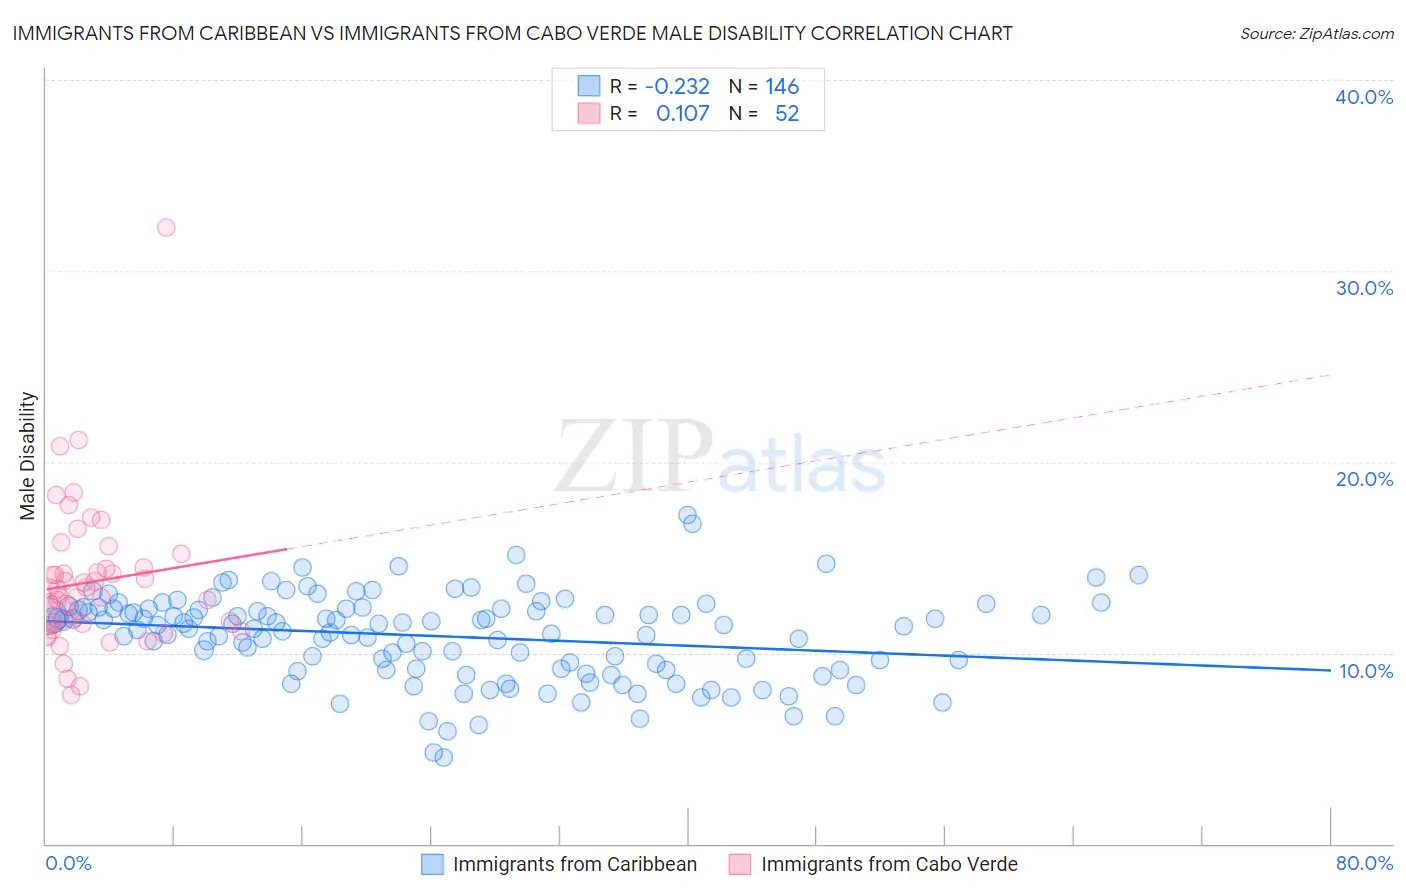
Immigrants from Caribbean vs Immigrants from Cabo Verde Male Disability Correlation Chart
The statistical analysis conducted on geographies consisting of 449,911,553 people shows a weak negative correlation between the proportion of Immigrants from Caribbean and percentage of males with a disability in the United States with a correlation coefficient (R) of -0.232 and weighted average of 11.3%. Similarly, the statistical analysis conducted on geographies consisting of 38,149,674 people shows a poor positive correlation between the proportion of Immigrants from Cabo Verde and percentage of males with a disability in the United States with a correlation coefficient (R) of 0.107 and weighted average of 12.8%, a difference of 13.7%.
Male Disability Correlation Summary
| Measurement | Immigrants from Caribbean | Immigrants from Cabo Verde |
| Minimum | 4.5% | 7.8% |
| Maximum | 17.2% | 32.3% |
| Range | 12.7% | 24.5% |
| Mean | 10.9% | 13.7% |
| Median | 11.4% | 13.2% |
| Interquartile 25% (IQ1) | 9.2% | 11.5% |
| Interquartile 75% (IQ3) | 12.3% | 14.4% |
| Interquartile Range (IQR) | 3.2% | 3.0% |
| Standard Deviation (Sample) | 2.3% | 3.9% |
| Standard Deviation (Population) | 2.2% | 3.8% |
Similar Demographics by Male Disability
Demographics Similar to Immigrants from Caribbean by Male Disability
In terms of male disability, the demographic groups most similar to Immigrants from Caribbean are Honduran (11.3%, a difference of 0.020%), Australian (11.3%, a difference of 0.040%), Immigrants from Norway (11.3%, a difference of 0.15%), Syrian (11.2%, a difference of 0.29%), and Immigrants from Honduras (11.2%, a difference of 0.41%).
| Demographics | Rating | Rank | Male Disability |
| Romanians | 50.7 /100 | #172 | Average 11.2% |
| Immigrants | Burma/Myanmar | 50.4 /100 | #173 | Average 11.2% |
| Maltese | 50.0 /100 | #174 | Average 11.2% |
| Immigrants | Honduras | 48.7 /100 | #175 | Average 11.2% |
| Syrians | 46.6 /100 | #176 | Average 11.2% |
| Immigrants | Norway | 44.2 /100 | #177 | Average 11.3% |
| Australians | 42.2 /100 | #178 | Average 11.3% |
| Immigrants | Caribbean | 41.4 /100 | #179 | Average 11.3% |
| Hondurans | 41.1 /100 | #180 | Average 11.3% |
| Immigrants | Senegal | 34.4 /100 | #181 | Fair 11.3% |
| Immigrants | Belize | 33.7 /100 | #182 | Fair 11.3% |
| Immigrants | Central America | 32.9 /100 | #183 | Fair 11.3% |
| Iraqis | 30.5 /100 | #184 | Fair 11.3% |
| Pakistanis | 30.3 /100 | #185 | Fair 11.3% |
| Immigrants | Zaire | 27.6 /100 | #186 | Fair 11.4% |
Demographics Similar to Immigrants from Cabo Verde by Male Disability
In terms of male disability, the demographic groups most similar to Immigrants from Cabo Verde are Pima (12.8%, a difference of 0.15%), Yup'ik (12.8%, a difference of 0.19%), White/Caucasian (12.8%, a difference of 0.24%), English (12.8%, a difference of 0.30%), and Cape Verdean (12.8%, a difference of 0.38%).
| Demographics | Rating | Rank | Male Disability |
| Irish | 0.0 /100 | #282 | Tragic 12.7% |
| Germans | 0.0 /100 | #283 | Tragic 12.7% |
| Spanish | 0.0 /100 | #284 | Tragic 12.7% |
| Welsh | 0.0 /100 | #285 | Tragic 12.7% |
| Scottish | 0.0 /100 | #286 | Tragic 12.8% |
| Cape Verdeans | 0.0 /100 | #287 | Tragic 12.8% |
| Yup'ik | 0.0 /100 | #288 | Tragic 12.8% |
| Immigrants | Cabo Verde | 0.0 /100 | #289 | Tragic 12.8% |
| Pima | 0.0 /100 | #290 | Tragic 12.8% |
| Whites/Caucasians | 0.0 /100 | #291 | Tragic 12.8% |
| English | 0.0 /100 | #292 | Tragic 12.8% |
| Yaqui | 0.0 /100 | #293 | Tragic 12.9% |
| Marshallese | 0.0 /100 | #294 | Tragic 12.9% |
| Immigrants | Micronesia | 0.0 /100 | #295 | Tragic 12.9% |
| Immigrants | Nonimmigrants | 0.0 /100 | #296 | Tragic 12.9% |