Immigrants from Bangladesh vs Immigrants from Honduras Disability
COMPARE
Immigrants from Bangladesh
Immigrants from Honduras
Disability
Disability Comparison
Immigrants from Bangladesh
Immigrants from Honduras
11.0%
DISABILITY
99.4/ 100
METRIC RATING
73rd/ 347
METRIC RANK
11.8%
DISABILITY
37.8/ 100
METRIC RATING
180th/ 347
METRIC RANK
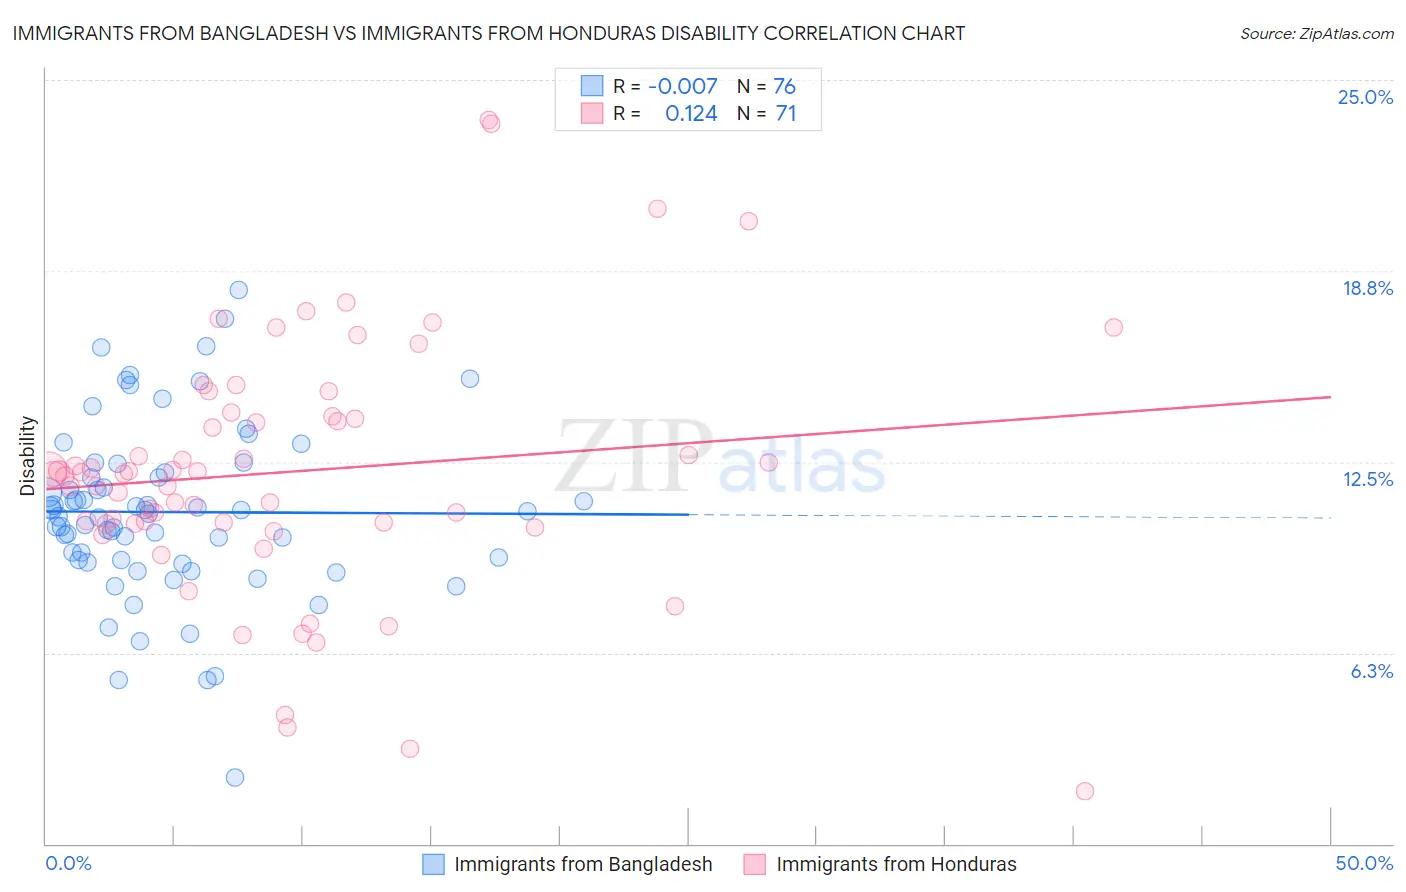
Immigrants from Bangladesh vs Immigrants from Honduras Disability Correlation Chart
The statistical analysis conducted on geographies consisting of 203,681,274 people shows no correlation between the proportion of Immigrants from Bangladesh and percentage of population with a disability in the United States with a correlation coefficient (R) of -0.007 and weighted average of 11.0%. Similarly, the statistical analysis conducted on geographies consisting of 322,561,761 people shows a poor positive correlation between the proportion of Immigrants from Honduras and percentage of population with a disability in the United States with a correlation coefficient (R) of 0.124 and weighted average of 11.8%, a difference of 6.5%.
Disability Correlation Summary
| Measurement | Immigrants from Bangladesh | Immigrants from Honduras |
| Minimum | 2.2% | 1.7% |
| Maximum | 18.1% | 23.7% |
| Range | 15.9% | 22.0% |
| Mean | 10.9% | 12.2% |
| Median | 10.8% | 12.1% |
| Interquartile 25% (IQ1) | 9.3% | 10.5% |
| Interquartile 75% (IQ3) | 12.1% | 14.0% |
| Interquartile Range (IQR) | 2.8% | 3.5% |
| Standard Deviation (Sample) | 2.8% | 4.1% |
| Standard Deviation (Population) | 2.8% | 4.1% |
Similar Demographics by Disability
Demographics Similar to Immigrants from Bangladesh by Disability
In terms of disability, the demographic groups most similar to Immigrants from Bangladesh are Immigrants from Serbia (11.0%, a difference of 0.020%), Immigrants from Chile (11.0%, a difference of 0.030%), Immigrants from Vietnam (11.0%, a difference of 0.040%), Sierra Leonean (11.0%, a difference of 0.070%), and Immigrants from Belgium (11.0%, a difference of 0.070%).
| Demographics | Rating | Rank | Disability |
| Laotians | 99.6 /100 | #66 | Exceptional 11.0% |
| Colombians | 99.6 /100 | #67 | Exceptional 11.0% |
| Immigrants | Afghanistan | 99.6 /100 | #68 | Exceptional 11.0% |
| Sri Lankans | 99.5 /100 | #69 | Exceptional 11.0% |
| Immigrants | France | 99.4 /100 | #70 | Exceptional 11.0% |
| Immigrants | Lebanon | 99.4 /100 | #71 | Exceptional 11.0% |
| Immigrants | Chile | 99.4 /100 | #72 | Exceptional 11.0% |
| Immigrants | Bangladesh | 99.4 /100 | #73 | Exceptional 11.0% |
| Immigrants | Serbia | 99.4 /100 | #74 | Exceptional 11.0% |
| Immigrants | Vietnam | 99.4 /100 | #75 | Exceptional 11.0% |
| Sierra Leoneans | 99.3 /100 | #76 | Exceptional 11.0% |
| Immigrants | Belgium | 99.3 /100 | #77 | Exceptional 11.0% |
| Immigrants | Cameroon | 99.3 /100 | #78 | Exceptional 11.1% |
| Immigrants | Jordan | 99.3 /100 | #79 | Exceptional 11.1% |
| Immigrants | Ireland | 99.3 /100 | #80 | Exceptional 11.1% |
Demographics Similar to Immigrants from Honduras by Disability
In terms of disability, the demographic groups most similar to Immigrants from Honduras are Immigrants from Oceania (11.8%, a difference of 0.17%), Immigrants from Armenia (11.7%, a difference of 0.19%), Icelander (11.8%, a difference of 0.19%), Honduran (11.8%, a difference of 0.32%), and Greek (11.7%, a difference of 0.38%).
| Demographics | Rating | Rank | Disability |
| Maltese | 50.6 /100 | #173 | Average 11.7% |
| Albanians | 50.0 /100 | #174 | Average 11.7% |
| Haitians | 48.6 /100 | #175 | Average 11.7% |
| Immigrants | Western Africa | 47.5 /100 | #176 | Average 11.7% |
| Immigrants | Central America | 46.6 /100 | #177 | Average 11.7% |
| Greeks | 46.2 /100 | #178 | Average 11.7% |
| Immigrants | Armenia | 41.9 /100 | #179 | Average 11.7% |
| Immigrants | Honduras | 37.8 /100 | #180 | Fair 11.8% |
| Immigrants | Oceania | 34.3 /100 | #181 | Fair 11.8% |
| Icelanders | 34.0 /100 | #182 | Fair 11.8% |
| Hondurans | 31.2 /100 | #183 | Fair 11.8% |
| Iraqis | 30.0 /100 | #184 | Fair 11.8% |
| Immigrants | Burma/Myanmar | 28.5 /100 | #185 | Fair 11.8% |
| Immigrants | Scotland | 28.2 /100 | #186 | Fair 11.8% |
| Lebanese | 27.9 /100 | #187 | Fair 11.8% |