Hawaiian vs Immigrants from Mexico Male Disability
COMPARE
Hawaiian
Immigrants from Mexico
Male Disability
Male Disability Comparison
Hawaiians
Immigrants from Mexico
12.3%
MALE DISABILITY
0.1/ 100
METRIC RATING
266th/ 347
METRIC RANK
11.5%
MALE DISABILITY
12.6/ 100
METRIC RATING
202nd/ 347
METRIC RANK
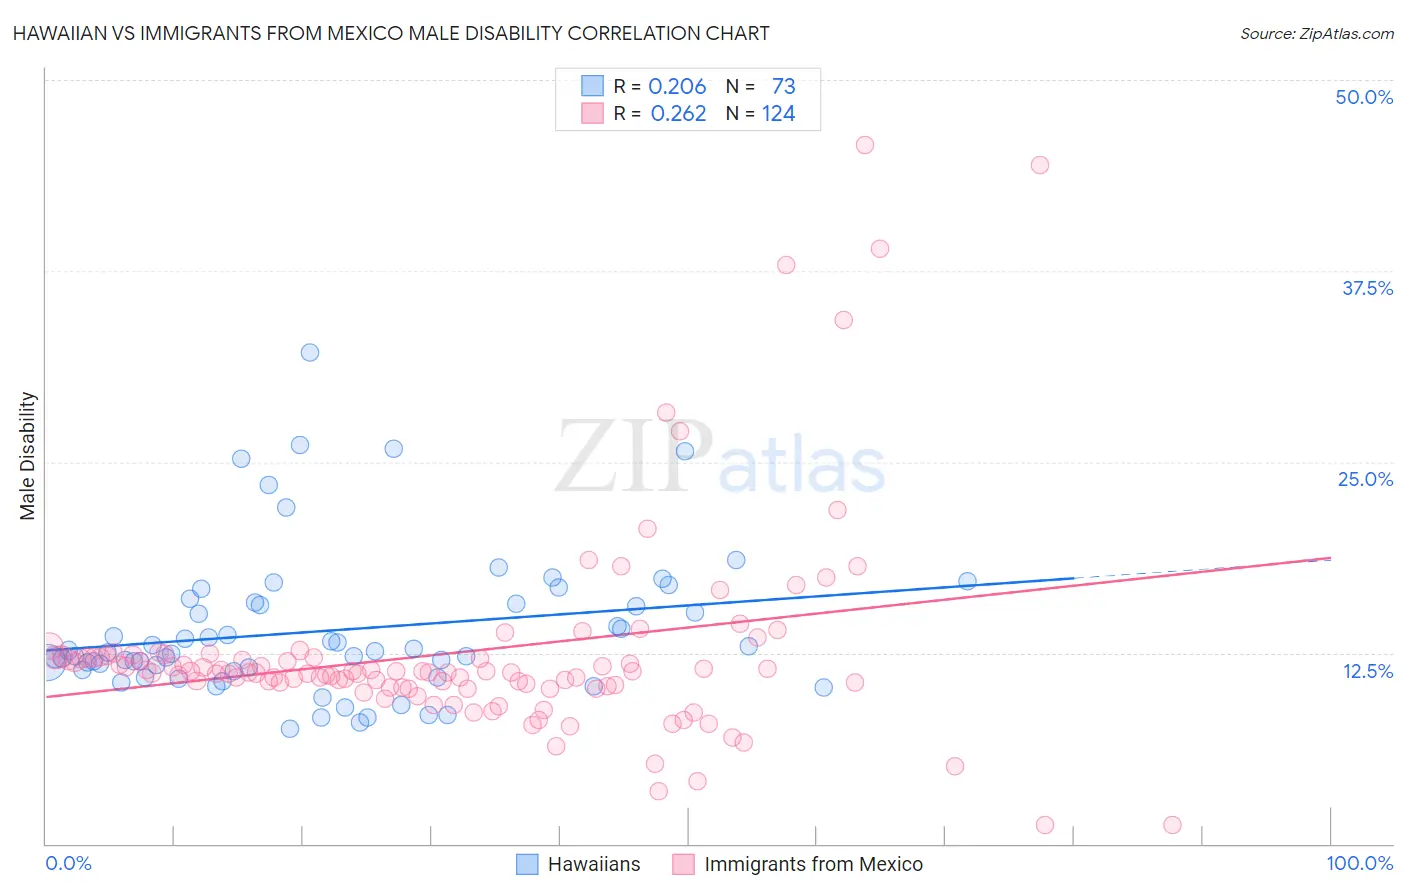
Hawaiian vs Immigrants from Mexico Male Disability Correlation Chart
The statistical analysis conducted on geographies consisting of 327,496,415 people shows a weak positive correlation between the proportion of Hawaiians and percentage of males with a disability in the United States with a correlation coefficient (R) of 0.206 and weighted average of 12.3%. Similarly, the statistical analysis conducted on geographies consisting of 513,525,240 people shows a weak positive correlation between the proportion of Immigrants from Mexico and percentage of males with a disability in the United States with a correlation coefficient (R) of 0.262 and weighted average of 11.5%, a difference of 6.5%.
Male Disability Correlation Summary
| Measurement | Hawaiian | Immigrants from Mexico |
| Minimum | 7.5% | 1.2% |
| Maximum | 32.2% | 45.8% |
| Range | 24.7% | 44.6% |
| Mean | 14.0% | 12.5% |
| Median | 12.6% | 11.2% |
| Interquartile 25% (IQ1) | 11.3% | 10.3% |
| Interquartile 75% (IQ3) | 15.7% | 12.2% |
| Interquartile Range (IQR) | 4.4% | 1.9% |
| Standard Deviation (Sample) | 4.7% | 6.8% |
| Standard Deviation (Population) | 4.7% | 6.8% |
Similar Demographics by Male Disability
Demographics Similar to Hawaiians by Male Disability
In terms of male disability, the demographic groups most similar to Hawaiians are Immigrants from Portugal (12.3%, a difference of 0.020%), Immigrants from Germany (12.3%, a difference of 0.050%), Portuguese (12.3%, a difference of 0.18%), Czechoslovakian (12.3%, a difference of 0.18%), and Spaniard (12.3%, a difference of 0.26%).
| Demographics | Rating | Rank | Male Disability |
| Belgians | 0.3 /100 | #259 | Tragic 12.1% |
| Swedes | 0.3 /100 | #260 | Tragic 12.1% |
| Slavs | 0.2 /100 | #261 | Tragic 12.2% |
| Norwegians | 0.2 /100 | #262 | Tragic 12.2% |
| Canadians | 0.2 /100 | #263 | Tragic 12.2% |
| Nepalese | 0.2 /100 | #264 | Tragic 12.2% |
| Immigrants | Portugal | 0.1 /100 | #265 | Tragic 12.3% |
| Hawaiians | 0.1 /100 | #266 | Tragic 12.3% |
| Immigrants | Germany | 0.1 /100 | #267 | Tragic 12.3% |
| Portuguese | 0.1 /100 | #268 | Tragic 12.3% |
| Czechoslovakians | 0.1 /100 | #269 | Tragic 12.3% |
| Spaniards | 0.1 /100 | #270 | Tragic 12.3% |
| Scandinavians | 0.1 /100 | #271 | Tragic 12.3% |
| Hmong | 0.0 /100 | #272 | Tragic 12.5% |
| Native Hawaiians | 0.0 /100 | #273 | Tragic 12.5% |
Demographics Similar to Immigrants from Mexico by Male Disability
In terms of male disability, the demographic groups most similar to Immigrants from Mexico are Immigrants from Iraq (11.5%, a difference of 0.040%), Immigrants from Panama (11.5%, a difference of 0.040%), Jamaican (11.5%, a difference of 0.23%), Immigrants from Cambodia (11.5%, a difference of 0.25%), and Serbian (11.5%, a difference of 0.25%).
| Demographics | Rating | Rank | Male Disability |
| Immigrants | Oceania | 20.9 /100 | #195 | Fair 11.4% |
| West Indians | 18.4 /100 | #196 | Poor 11.4% |
| Somalis | 18.2 /100 | #197 | Poor 11.4% |
| Immigrants | Jamaica | 16.3 /100 | #198 | Poor 11.5% |
| Lebanese | 15.4 /100 | #199 | Poor 11.5% |
| Immigrants | Iraq | 13.0 /100 | #200 | Poor 11.5% |
| Immigrants | Panama | 13.0 /100 | #201 | Poor 11.5% |
| Immigrants | Mexico | 12.6 /100 | #202 | Poor 11.5% |
| Jamaicans | 10.9 /100 | #203 | Poor 11.5% |
| Immigrants | Cambodia | 10.8 /100 | #204 | Poor 11.5% |
| Serbians | 10.7 /100 | #205 | Poor 11.5% |
| Ukrainians | 10.6 /100 | #206 | Poor 11.5% |
| Immigrants | Somalia | 10.4 /100 | #207 | Poor 11.5% |
| Icelanders | 10.1 /100 | #208 | Poor 11.6% |
| Spanish American Indians | 10.1 /100 | #209 | Poor 11.6% |