Ghanaian vs Immigrants from Liberia Female Disability

COMPARE

Ghanaian
Race
Ancestry
AfghanAfricanAlaska NativeAlaskan AthabascanAlbanianAleutAlsatianAmericanApacheArabArapahoArgentineanArmenianAssyrian/Chaldean/SyriacAustralianAustrianBahamianBangladeshiBarbadianBasqueBelgianBelizeanBermudanBhutaneseBlackfeetBolivianBrazilianBritishBritish West IndianBulgarianBurmeseCajunCambodianCanadianCape VerdeanCarpatho RusynCelticCentral AmericanCentral American IndianCherokeeCheyenneChickasawChileanChineseChippewaChoctawColombianColvilleComancheCosta RicanCreeCreekCroatianCrowCubanCypriotCzechCzechoslovakianDanishDelawareDominicanDutchDutch West IndianEastern EuropeanEcuadorianEgyptianEnglishEstonianEthiopianEuropeanFijianFilipinoFinnishFrenchFrench American IndianFrench CanadianGermanGerman RussianGhanaianGreekGuamanian/ChamorroGuatemalanGuyaneseHaitianHmongHonduranHopiHoumaHungarianIcelanderIndian (Asian)IndonesianInupiatIranianIraqiIrishIroquoisIsraeliItalianJamaicanJapaneseJordanianKenyanKiowaKoreanLaotianLatvianLebaneseLiberianLithuanianLumbeeLuxembourgerMacedonianMalaysianMalteseMarshalleseMenomineeMexicanMexican American IndianMongolianMoroccanNative HawaiianNavajoNepaleseNew ZealanderNicaraguanNigerianNorthern EuropeanNorwegianOkinawanOsageOttawaPaiutePakistaniPalestinianPanamanianParaguayanPennsylvania GermanPeruvianPimaPolishPortuguesePotawatomiPuebloPuerto RicanPuget Sound SalishRomanianRussianSalvadoranSamoanScandinavianScotch-IrishScottishSeminoleSenegaleseSerbianShoshoneSierra LeoneanSiouxSlavicSlovakSloveneSomaliSouth AfricanSouth AmericanSouth American IndianSoviet UnionSpaniardSpanishSpanish AmericanSpanish American IndianSri LankanSubsaharan AfricanSudaneseSwedishSwissSyrianTaiwaneseThaiTlingit-HaidaTohono O'OdhamTonganTrinidadian and TobagonianTsimshianTurkishU.S. Virgin IslanderUgandanUkrainianUruguayanUteVenezuelanVietnameseWelshWest IndianYakamaYaquiYugoslavianYumanYup'ikZimbabwean
Immigration
NonimmigrantsImmigrantsAfghanistanAfricaAlbaniaArgentinaArmeniaAsiaAustraliaAustriaBahamasBangladeshBarbadosBelarusBelgiumBelizeBoliviaBosnia and HerzegovinaBrazilBulgariaBurma/MyanmarCabo VerdeCambodiaCameroonCanadaCaribbeanCentral AmericaChileChinaColombiaCongoCosta RicaCroatiaCubaCzechoslovakiaDenmarkDominicaDominican RepublicEastern AfricaEastern AsiaEastern EuropeEcuadorEgyptEl SalvadorEnglandEritreaEthiopiaEuropeFijiFranceGermanyGhanaGreeceGrenadaGuatemalaGuyanaHaitiHondurasHong KongHungaryIndiaIndonesiaIranIraqIrelandIsraelItalyJamaicaJapanJordanKazakhstanKenyaKoreaKuwaitLaosLatin AmericaLatviaLebanonLithuaniaMalaysiaMexicoMicronesiaMiddle AfricaMoldovaMoroccoNepalNetherlandsNicaraguaNigeriaNorth AmericaNorth MacedoniaNorthern AfricaNorthern EuropeNorwayOceaniaPakistanPanamaPeruPhilippinesPolandPortugalRomaniaRussiaSaudi ArabiaScotlandSenegalSerbiaSierra LeoneSingaporeSomaliaSouth AfricaSouth AmericaSouth Central AsiaSouth Eastern AsiaSouthern EuropeSpainSri LankaSt. Vincent and the GrenadinesSudanSwedenSwitzerlandSyriaTaiwanThailandTrinidad and TobagoTurkeyUgandaUkraineUruguayUzbekistanVenezuelaVietnamWest IndiesWestern AfricaWestern AsiaWestern EuropeYemenZaireZimbabweAzores
Immigrants from Liberia
Race
Ancestry
AfghanAfricanAlaska NativeAlaskan AthabascanAlbanianAleutAlsatianAmericanApacheArabArapahoArgentineanArmenianAssyrian/Chaldean/SyriacAustralianAustrianBahamianBangladeshiBarbadianBasqueBelgianBelizeanBermudanBhutaneseBlackfeetBolivianBrazilianBritishBritish West IndianBulgarianBurmeseCajunCambodianCanadianCape VerdeanCarpatho RusynCelticCentral AmericanCentral American IndianCherokeeCheyenneChickasawChileanChineseChippewaChoctawColombianColvilleComancheCosta RicanCreeCreekCroatianCrowCubanCypriotCzechCzechoslovakianDanishDelawareDominicanDutchDutch West IndianEastern EuropeanEcuadorianEgyptianEnglishEstonianEthiopianEuropeanFijianFilipinoFinnishFrenchFrench American IndianFrench CanadianGermanGerman RussianGreekGuamanian/ChamorroGuatemalanGuyaneseHaitianHmongHonduranHopiHoumaHungarianIcelanderIndian (Asian)IndonesianInupiatIranianIraqiIrishIroquoisIsraeliItalianJamaicanJapaneseJordanianKenyanKiowaKoreanLaotianLatvianLebaneseLiberianLithuanianLumbeeLuxembourgerMacedonianMalaysianMalteseMarshalleseMenomineeMexicanMexican American IndianMongolianMoroccanNative HawaiianNavajoNepaleseNew ZealanderNicaraguanNigerianNorthern EuropeanNorwegianOkinawanOsageOttawaPaiutePakistaniPalestinianPanamanianParaguayanPennsylvania GermanPeruvianPimaPolishPortuguesePotawatomiPuebloPuerto RicanPuget Sound SalishRomanianRussianSalvadoranSamoanScandinavianScotch-IrishScottishSeminoleSenegaleseSerbianShoshoneSierra LeoneanSiouxSlavicSlovakSloveneSomaliSouth AfricanSouth AmericanSouth American IndianSoviet UnionSpaniardSpanishSpanish AmericanSpanish American IndianSri LankanSubsaharan AfricanSudaneseSwedishSwissSyrianTaiwaneseThaiTlingit-HaidaTohono O'OdhamTonganTrinidadian and TobagonianTsimshianTurkishU.S. Virgin IslanderUgandanUkrainianUruguayanUteVenezuelanVietnameseWelshWest IndianYakamaYaquiYugoslavianYumanYup'ikZimbabwean
Immigration
NonimmigrantsImmigrantsAfghanistanAfricaAlbaniaArgentinaArmeniaAsiaAustraliaAustriaBahamasBangladeshBarbadosBelarusBelgiumBelizeBoliviaBosnia and HerzegovinaBrazilBulgariaBurma/MyanmarCabo VerdeCambodiaCameroonCanadaCaribbeanCentral AmericaChileChinaColombiaCongoCosta RicaCroatiaCubaCzechoslovakiaDenmarkDominicaDominican RepublicEastern AfricaEastern AsiaEastern EuropeEcuadorEgyptEl SalvadorEnglandEritreaEthiopiaEuropeFijiFranceGermanyGhanaGreeceGrenadaGuatemalaGuyanaHaitiHondurasHong KongHungaryIndiaIndonesiaIranIraqIrelandIsraelItalyJamaicaJapanJordanKazakhstanKenyaKoreaKuwaitLaosLatin AmericaLatviaLebanonLiberiaLithuaniaMalaysiaMexicoMicronesiaMiddle AfricaMoldovaMoroccoNepalNetherlandsNicaraguaNigeriaNorth AmericaNorth MacedoniaNorthern AfricaNorthern EuropeNorwayOceaniaPakistanPanamaPeruPhilippinesPolandPortugalRomaniaRussiaSaudi ArabiaScotlandSenegalSerbiaSierra LeoneSingaporeSomaliaSouth AfricaSouth AmericaSouth Central AsiaSouth Eastern AsiaSouthern EuropeSpainSri LankaSt. Vincent and the GrenadinesSudanSwedenSwitzerlandSyriaTaiwanThailandTrinidad and TobagoTurkeyUgandaUkraineUruguayUzbekistanVenezuelaVietnamWest IndiesWestern AfricaWestern AsiaWestern EuropeYemenZaireZimbabweAzores
Female Disability
Income
Poverty
Unemployment
Labor Participation
Family Structure
Vehicle Availability
Education Level
Disability

Female Disability Comparison

Ghanaians

Immigrants from Liberia

Good
Tragic
12.1%
FEMALE DISABILITY
76.6/ 100
METRIC RATING
155th/ 347
METRIC RANK
12.9%
FEMALE DISABILITY
0.3/ 100
METRIC RATING
270th/ 347
METRIC RANK

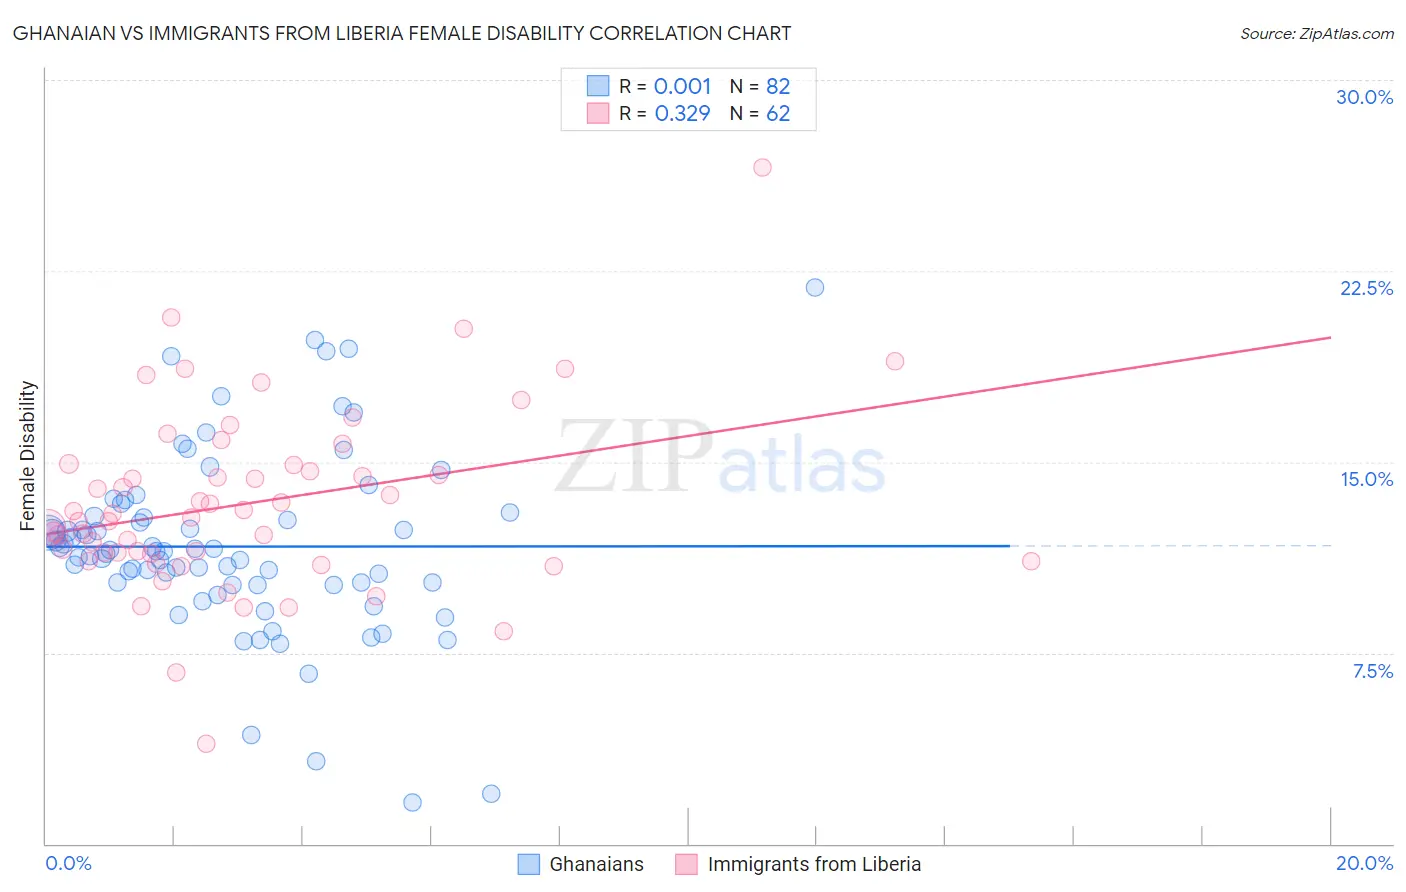
Ghanaian vs Immigrants from Liberia Female Disability Correlation Chart

The statistical analysis conducted on geographies consisting of 190,696,570 people shows no correlation between the proportion of Ghanaians and percentage of females with a disability in the United States with a correlation coefficient (R) of 0.001 and weighted average of 12.1%. Similarly, the statistical analysis conducted on geographies consisting of 135,259,122 people shows a mild positive correlation between the proportion of Immigrants from Liberia and percentage of females with a disability in the United States with a correlation coefficient (R) of 0.329 and weighted average of 12.9%, a difference of 6.6%.
Ghanaian vs Immigrants from Liberia Female Disability

Female Disability Correlation Summary

MeasurementGhanaianImmigrants from Liberia
Minimum1.6%3.9%
Maximum21.9%26.5%
Range20.2%22.6%
Mean11.7%13.4%
Median11.5%12.9%
Interquartile 25% (IQ1)10.2%11.4%
Interquartile 75% (IQ3)12.9%14.9%
Interquartile Range (IQR)2.7%3.5%
Standard Deviation (Sample)3.6%3.6%
Standard Deviation (Population)3.6%3.6%

Similar Demographics by Female Disability

Demographics Similar to Ghanaians by Female Disability

In terms of female disability, the demographic groups most similar to Ghanaians are Syrian (12.1%, a difference of 0.020%), Sudanese (12.0%, a difference of 0.14%), Immigrants from Scotland (12.0%, a difference of 0.15%), Moroccan (12.1%, a difference of 0.19%), and Danish (12.1%, a difference of 0.20%).
DemographicsRating | RankFemale Disability
Immigrants | Kenya
83.1
/100
|
#148
Excellent
12.0%
Greeks
82.0
/100
|
#149
Excellent
12.0%
Immigrants | Moldova
81.4
/100
|
#150
Excellent
12.0%
Icelanders
80.7
/100
|
#151
Excellent
12.0%
Immigrants | Scotland
79.3
/100
|
#152
Good
12.0%
Sudanese
79.1
/100
|
#153
Good
12.0%
Syrians
76.9
/100
|
#154
Good
12.1%
Ghanaians
76.6
/100
|
#155
Good
12.1%
Moroccans
72.9
/100
|
#156
Good
12.1%
Danes
72.5
/100
|
#157
Good
12.1%
Immigrants | Middle Africa
72.4
/100
|
#158
Good
12.1%
Immigrants | Central America
67.7
/100
|
#159
Good
12.1%
Immigrants | Guatemala
66.0
/100
|
#160
Good
12.1%
Guyanese
64.7
/100
|
#161
Good
12.1%
Immigrants | Ukraine
64.3
/100
|
#162
Good
12.1%

Demographics Similar to Immigrants from Liberia by Female Disability

In terms of female disability, the demographic groups most similar to Immigrants from Liberia are Indonesian (12.8%, a difference of 0.18%), Immigrants from Laos (12.8%, a difference of 0.24%), Senegalese (12.8%, a difference of 0.27%), Finnish (12.8%, a difference of 0.28%), and West Indian (12.8%, a difference of 0.40%).
DemographicsRating | RankFemale Disability
Spaniards
0.7
/100
|
#263
Tragic
12.8%
Alaska Natives
0.6
/100
|
#264
Tragic
12.8%
West Indians
0.5
/100
|
#265
Tragic
12.8%
Finns
0.4
/100
|
#266
Tragic
12.8%
Senegalese
0.4
/100
|
#267
Tragic
12.8%
Immigrants | Laos
0.4
/100
|
#268
Tragic
12.8%
Indonesians
0.4
/100
|
#269
Tragic
12.8%
Immigrants | Liberia
0.3
/100
|
#270
Tragic
12.9%
Dutch
0.2
/100
|
#271
Tragic
12.9%
Germans
0.1
/100
|
#272
Tragic
12.9%
Sioux
0.1
/100
|
#273
Tragic
12.9%
Portuguese
0.1
/100
|
#274
Tragic
13.0%
Cheyenne
0.1
/100
|
#275
Tragic
13.0%
Immigrants | Dominica
0.1
/100
|
#276
Tragic
13.0%
Spanish
0.1
/100
|
#277
Tragic
13.0%