Ghanaian vs Chippewa Female Disability
COMPARE
Ghanaian
Chippewa
Female Disability
Female Disability Comparison
Ghanaians
Chippewa
12.1%
FEMALE DISABILITY
76.6/ 100
METRIC RATING
155th/ 347
METRIC RANK
14.0%
FEMALE DISABILITY
0.0/ 100
METRIC RATING
317th/ 347
METRIC RANK
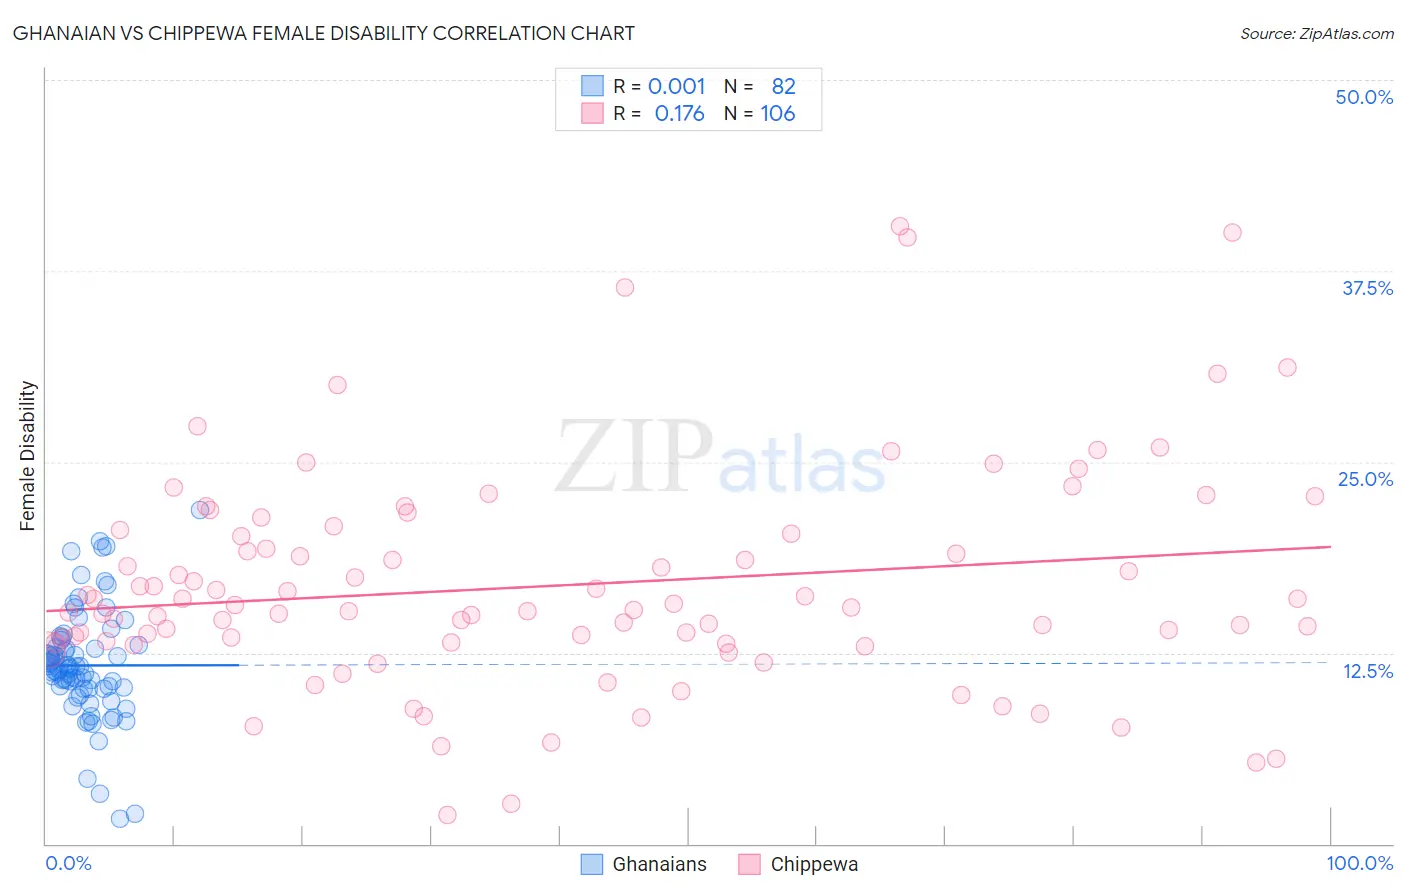
Ghanaian vs Chippewa Female Disability Correlation Chart
The statistical analysis conducted on geographies consisting of 190,696,570 people shows no correlation between the proportion of Ghanaians and percentage of females with a disability in the United States with a correlation coefficient (R) of 0.001 and weighted average of 12.1%. Similarly, the statistical analysis conducted on geographies consisting of 215,042,988 people shows a poor positive correlation between the proportion of Chippewa and percentage of females with a disability in the United States with a correlation coefficient (R) of 0.176 and weighted average of 14.0%, a difference of 16.0%.
Female Disability Correlation Summary
| Measurement | Ghanaian | Chippewa |
| Minimum | 1.6% | 1.9% |
| Maximum | 21.9% | 40.4% |
| Range | 20.2% | 38.5% |
| Mean | 11.7% | 16.9% |
| Median | 11.5% | 15.4% |
| Interquartile 25% (IQ1) | 10.2% | 13.1% |
| Interquartile 75% (IQ3) | 12.9% | 20.3% |
| Interquartile Range (IQR) | 2.7% | 7.2% |
| Standard Deviation (Sample) | 3.6% | 7.2% |
| Standard Deviation (Population) | 3.6% | 7.2% |
Similar Demographics by Female Disability
Demographics Similar to Ghanaians by Female Disability
In terms of female disability, the demographic groups most similar to Ghanaians are Syrian (12.1%, a difference of 0.020%), Sudanese (12.0%, a difference of 0.14%), Immigrants from Scotland (12.0%, a difference of 0.15%), Moroccan (12.1%, a difference of 0.19%), and Danish (12.1%, a difference of 0.20%).
| Demographics | Rating | Rank | Female Disability |
| Immigrants | Kenya | 83.1 /100 | #148 | Excellent 12.0% |
| Greeks | 82.0 /100 | #149 | Excellent 12.0% |
| Immigrants | Moldova | 81.4 /100 | #150 | Excellent 12.0% |
| Icelanders | 80.7 /100 | #151 | Excellent 12.0% |
| Immigrants | Scotland | 79.3 /100 | #152 | Good 12.0% |
| Sudanese | 79.1 /100 | #153 | Good 12.0% |
| Syrians | 76.9 /100 | #154 | Good 12.1% |
| Ghanaians | 76.6 /100 | #155 | Good 12.1% |
| Moroccans | 72.9 /100 | #156 | Good 12.1% |
| Danes | 72.5 /100 | #157 | Good 12.1% |
| Immigrants | Middle Africa | 72.4 /100 | #158 | Good 12.1% |
| Immigrants | Central America | 67.7 /100 | #159 | Good 12.1% |
| Immigrants | Guatemala | 66.0 /100 | #160 | Good 12.1% |
| Guyanese | 64.7 /100 | #161 | Good 12.1% |
| Immigrants | Ukraine | 64.3 /100 | #162 | Good 12.1% |
Demographics Similar to Chippewa by Female Disability
In terms of female disability, the demographic groups most similar to Chippewa are Spanish American (14.0%, a difference of 0.11%), Paiute (14.0%, a difference of 0.11%), Iroquois (14.0%, a difference of 0.40%), Alaskan Athabascan (13.9%, a difference of 0.47%), and American (14.1%, a difference of 0.74%).
| Demographics | Rating | Rank | Female Disability |
| Apache | 0.0 /100 | #310 | Tragic 13.7% |
| Hopi | 0.0 /100 | #311 | Tragic 13.7% |
| Delaware | 0.0 /100 | #312 | Tragic 13.8% |
| Blackfeet | 0.0 /100 | #313 | Tragic 13.8% |
| Puget Sound Salish | 0.0 /100 | #314 | Tragic 13.8% |
| Alaskan Athabascans | 0.0 /100 | #315 | Tragic 13.9% |
| Spanish Americans | 0.0 /100 | #316 | Tragic 14.0% |
| Chippewa | 0.0 /100 | #317 | Tragic 14.0% |
| Paiute | 0.0 /100 | #318 | Tragic 14.0% |
| Iroquois | 0.0 /100 | #319 | Tragic 14.0% |
| Americans | 0.0 /100 | #320 | Tragic 14.1% |
| Potawatomi | 0.0 /100 | #321 | Tragic 14.1% |
| Pueblo | 0.0 /100 | #322 | Tragic 14.1% |
| Blacks/African Americans | 0.0 /100 | #323 | Tragic 14.1% |
| Natives/Alaskans | 0.0 /100 | #324 | Tragic 14.1% |