Colombian vs Maltese Disability
COMPARE
Colombian
Maltese
Disability
Disability Comparison
Colombians
Maltese
11.0%
DISABILITY
99.6/ 100
METRIC RATING
67th/ 347
METRIC RANK
11.7%
DISABILITY
50.6/ 100
METRIC RATING
173rd/ 347
METRIC RANK
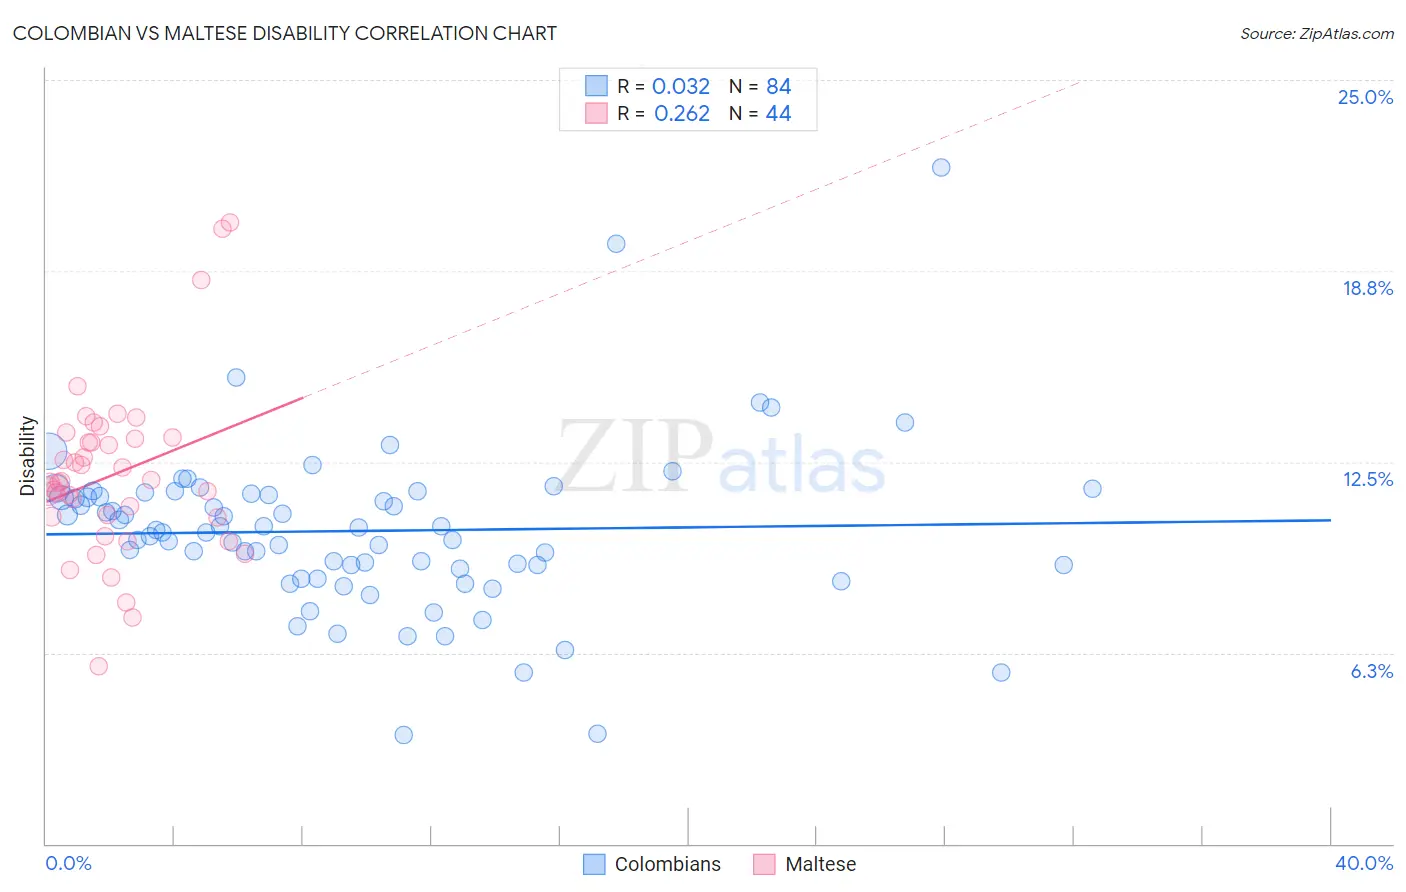
Colombian vs Maltese Disability Correlation Chart
The statistical analysis conducted on geographies consisting of 419,613,983 people shows no correlation between the proportion of Colombians and percentage of population with a disability in the United States with a correlation coefficient (R) of 0.032 and weighted average of 11.0%. Similarly, the statistical analysis conducted on geographies consisting of 126,476,999 people shows a weak positive correlation between the proportion of Maltese and percentage of population with a disability in the United States with a correlation coefficient (R) of 0.262 and weighted average of 11.7%, a difference of 6.5%.
Disability Correlation Summary
| Measurement | Colombian | Maltese |
| Minimum | 3.5% | 5.8% |
| Maximum | 22.2% | 20.3% |
| Range | 18.6% | 14.5% |
| Mean | 10.2% | 12.1% |
| Median | 10.2% | 11.8% |
| Interquartile 25% (IQ1) | 9.1% | 10.7% |
| Interquartile 75% (IQ3) | 11.4% | 13.3% |
| Interquartile Range (IQR) | 2.4% | 2.6% |
| Standard Deviation (Sample) | 2.7% | 2.8% |
| Standard Deviation (Population) | 2.7% | 2.8% |
Similar Demographics by Disability
Demographics Similar to Colombians by Disability
In terms of disability, the demographic groups most similar to Colombians are Laotian (11.0%, a difference of 0.080%), Bulgarian (11.0%, a difference of 0.10%), Immigrants from Sweden (11.0%, a difference of 0.11%), Immigrants from Afghanistan (11.0%, a difference of 0.12%), and Immigrants from Eritrea (11.0%, a difference of 0.30%).
| Demographics | Rating | Rank | Disability |
| Zimbabweans | 99.7 /100 | #60 | Exceptional 10.9% |
| Immigrants | Bulgaria | 99.7 /100 | #61 | Exceptional 10.9% |
| Immigrants | Northern Africa | 99.7 /100 | #62 | Exceptional 10.9% |
| Immigrants | Eritrea | 99.7 /100 | #63 | Exceptional 11.0% |
| Immigrants | Sweden | 99.6 /100 | #64 | Exceptional 11.0% |
| Bulgarians | 99.6 /100 | #65 | Exceptional 11.0% |
| Laotians | 99.6 /100 | #66 | Exceptional 11.0% |
| Colombians | 99.6 /100 | #67 | Exceptional 11.0% |
| Immigrants | Afghanistan | 99.6 /100 | #68 | Exceptional 11.0% |
| Sri Lankans | 99.5 /100 | #69 | Exceptional 11.0% |
| Immigrants | France | 99.4 /100 | #70 | Exceptional 11.0% |
| Immigrants | Lebanon | 99.4 /100 | #71 | Exceptional 11.0% |
| Immigrants | Chile | 99.4 /100 | #72 | Exceptional 11.0% |
| Immigrants | Bangladesh | 99.4 /100 | #73 | Exceptional 11.0% |
| Immigrants | Serbia | 99.4 /100 | #74 | Exceptional 11.0% |
Demographics Similar to Maltese by Disability
In terms of disability, the demographic groups most similar to Maltese are Albanian (11.7%, a difference of 0.030%), Trinidadian and Tobagonian (11.7%, a difference of 0.090%), Haitian (11.7%, a difference of 0.090%), Immigrants from Albania (11.7%, a difference of 0.10%), and Immigrants from Southern Europe (11.7%, a difference of 0.10%).
| Demographics | Rating | Rank | Disability |
| Pakistanis | 54.7 /100 | #166 | Average 11.7% |
| Estonians | 54.4 /100 | #167 | Average 11.7% |
| Immigrants | Latin America | 54.1 /100 | #168 | Average 11.7% |
| Immigrants | Austria | 53.4 /100 | #169 | Average 11.7% |
| Immigrants | Albania | 52.8 /100 | #170 | Average 11.7% |
| Immigrants | Southern Europe | 52.8 /100 | #171 | Average 11.7% |
| Trinidadians and Tobagonians | 52.7 /100 | #172 | Average 11.7% |
| Maltese | 50.6 /100 | #173 | Average 11.7% |
| Albanians | 50.0 /100 | #174 | Average 11.7% |
| Haitians | 48.6 /100 | #175 | Average 11.7% |
| Immigrants | Western Africa | 47.5 /100 | #176 | Average 11.7% |
| Immigrants | Central America | 46.6 /100 | #177 | Average 11.7% |
| Greeks | 46.2 /100 | #178 | Average 11.7% |
| Immigrants | Armenia | 41.9 /100 | #179 | Average 11.7% |
| Immigrants | Honduras | 37.8 /100 | #180 | Fair 11.8% |