Aleut vs Immigrants from Vietnam Disability
COMPARE
Aleut
Immigrants from Vietnam
Disability
Disability Comparison
Aleuts
Immigrants from Vietnam
13.1%
DISABILITY
0.0/ 100
METRIC RATING
292nd/ 347
METRIC RANK
11.0%
DISABILITY
99.4/ 100
METRIC RATING
75th/ 347
METRIC RANK
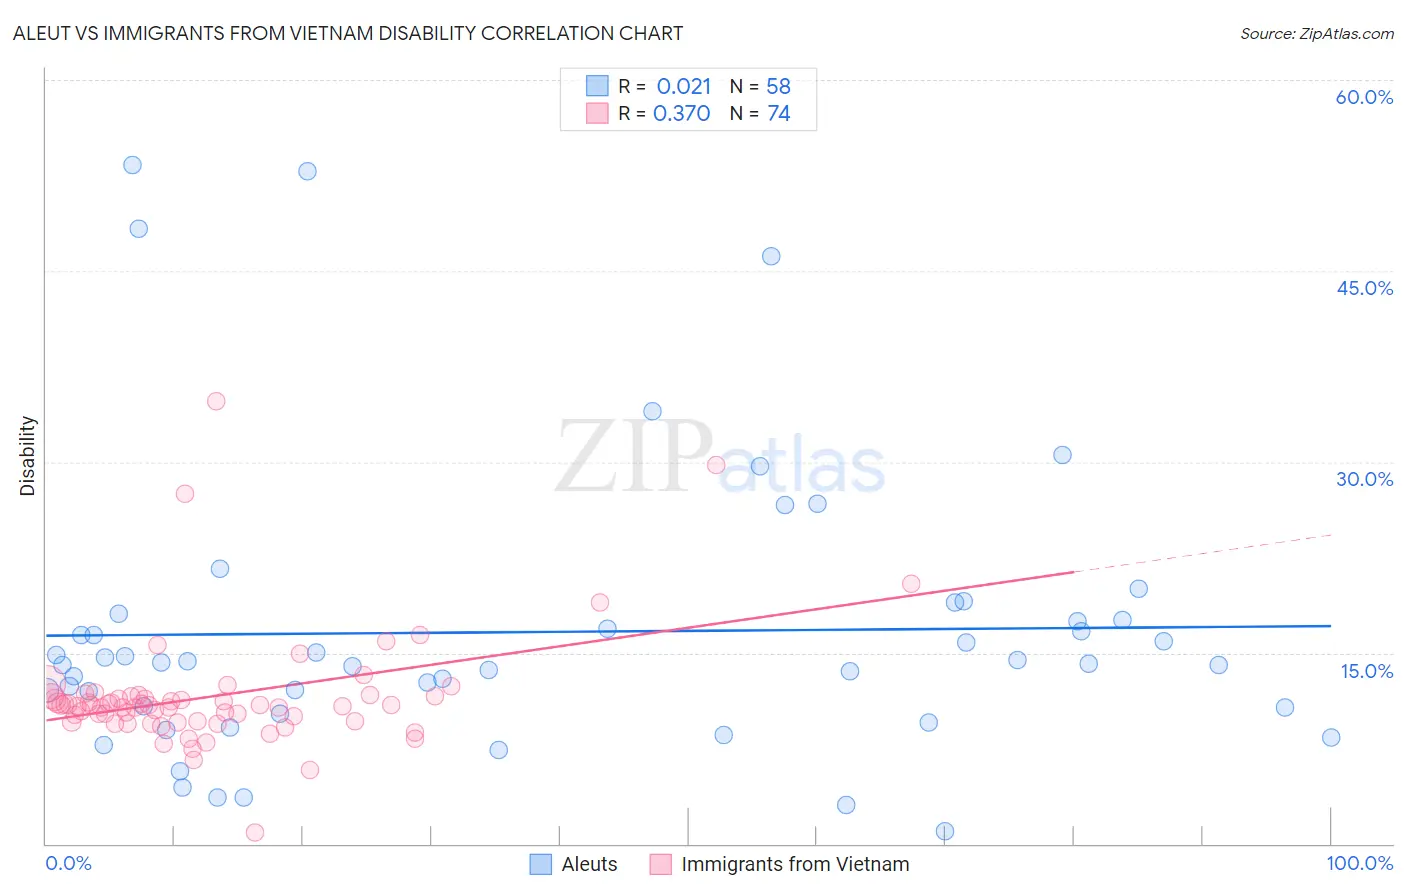
Aleut vs Immigrants from Vietnam Disability Correlation Chart
The statistical analysis conducted on geographies consisting of 61,782,940 people shows no correlation between the proportion of Aleuts and percentage of population with a disability in the United States with a correlation coefficient (R) of 0.021 and weighted average of 13.1%. Similarly, the statistical analysis conducted on geographies consisting of 404,777,334 people shows a mild positive correlation between the proportion of Immigrants from Vietnam and percentage of population with a disability in the United States with a correlation coefficient (R) of 0.370 and weighted average of 11.0%, a difference of 18.6%.
Disability Correlation Summary
| Measurement | Aleut | Immigrants from Vietnam |
| Minimum | 0.97% | 0.87% |
| Maximum | 53.3% | 34.7% |
| Range | 52.4% | 33.9% |
| Mean | 16.6% | 11.6% |
| Median | 14.2% | 10.9% |
| Interquartile 25% (IQ1) | 10.7% | 9.6% |
| Interquartile 75% (IQ3) | 17.6% | 11.6% |
| Interquartile Range (IQR) | 6.9% | 2.0% |
| Standard Deviation (Sample) | 11.3% | 4.8% |
| Standard Deviation (Population) | 11.2% | 4.7% |
Similar Demographics by Disability
Demographics Similar to Aleuts by Disability
In terms of disability, the demographic groups most similar to Aleuts are Marshallese (13.1%, a difference of 0.0%), Celtic (13.1%, a difference of 0.30%), Yaqui (13.1%, a difference of 0.36%), Nonimmigrants (13.2%, a difference of 0.42%), and Central American Indian (13.2%, a difference of 0.46%).
| Demographics | Rating | Rank | Disability |
| Crow | 0.0 /100 | #285 | Tragic 12.9% |
| English | 0.0 /100 | #286 | Tragic 13.0% |
| Africans | 0.0 /100 | #287 | Tragic 13.0% |
| Whites/Caucasians | 0.0 /100 | #288 | Tragic 13.0% |
| Slovaks | 0.0 /100 | #289 | Tragic 13.0% |
| Cheyenne | 0.0 /100 | #290 | Tragic 13.0% |
| Yaqui | 0.0 /100 | #291 | Tragic 13.1% |
| Aleuts | 0.0 /100 | #292 | Tragic 13.1% |
| Marshallese | 0.0 /100 | #293 | Tragic 13.1% |
| Celtics | 0.0 /100 | #294 | Tragic 13.1% |
| Immigrants | Nonimmigrants | 0.0 /100 | #295 | Tragic 13.2% |
| Central American Indians | 0.0 /100 | #296 | Tragic 13.2% |
| Hopi | 0.0 /100 | #297 | Tragic 13.2% |
| Alaska Natives | 0.0 /100 | #298 | Tragic 13.2% |
| French | 0.0 /100 | #299 | Tragic 13.2% |
Demographics Similar to Immigrants from Vietnam by Disability
In terms of disability, the demographic groups most similar to Immigrants from Vietnam are Immigrants from Serbia (11.0%, a difference of 0.020%), Sierra Leonean (11.0%, a difference of 0.030%), Immigrants from Belgium (11.0%, a difference of 0.030%), Immigrants from Bangladesh (11.0%, a difference of 0.040%), and Immigrants from Chile (11.0%, a difference of 0.070%).
| Demographics | Rating | Rank | Disability |
| Immigrants | Afghanistan | 99.6 /100 | #68 | Exceptional 11.0% |
| Sri Lankans | 99.5 /100 | #69 | Exceptional 11.0% |
| Immigrants | France | 99.4 /100 | #70 | Exceptional 11.0% |
| Immigrants | Lebanon | 99.4 /100 | #71 | Exceptional 11.0% |
| Immigrants | Chile | 99.4 /100 | #72 | Exceptional 11.0% |
| Immigrants | Bangladesh | 99.4 /100 | #73 | Exceptional 11.0% |
| Immigrants | Serbia | 99.4 /100 | #74 | Exceptional 11.0% |
| Immigrants | Vietnam | 99.4 /100 | #75 | Exceptional 11.0% |
| Sierra Leoneans | 99.3 /100 | #76 | Exceptional 11.0% |
| Immigrants | Belgium | 99.3 /100 | #77 | Exceptional 11.0% |
| Immigrants | Cameroon | 99.3 /100 | #78 | Exceptional 11.1% |
| Immigrants | Jordan | 99.3 /100 | #79 | Exceptional 11.1% |
| Immigrants | Ireland | 99.3 /100 | #80 | Exceptional 11.1% |
| Immigrants | Poland | 99.1 /100 | #81 | Exceptional 11.1% |
| Chileans | 99.1 /100 | #82 | Exceptional 11.1% |