Zip Codes with the Highest Percentage of Population Employed in Food Preparation & Serving in Norwalk, CT
RELATED REPORTS & OPTIONS
Food Preparation & Serving
Norwalk
Compare Zip Codes
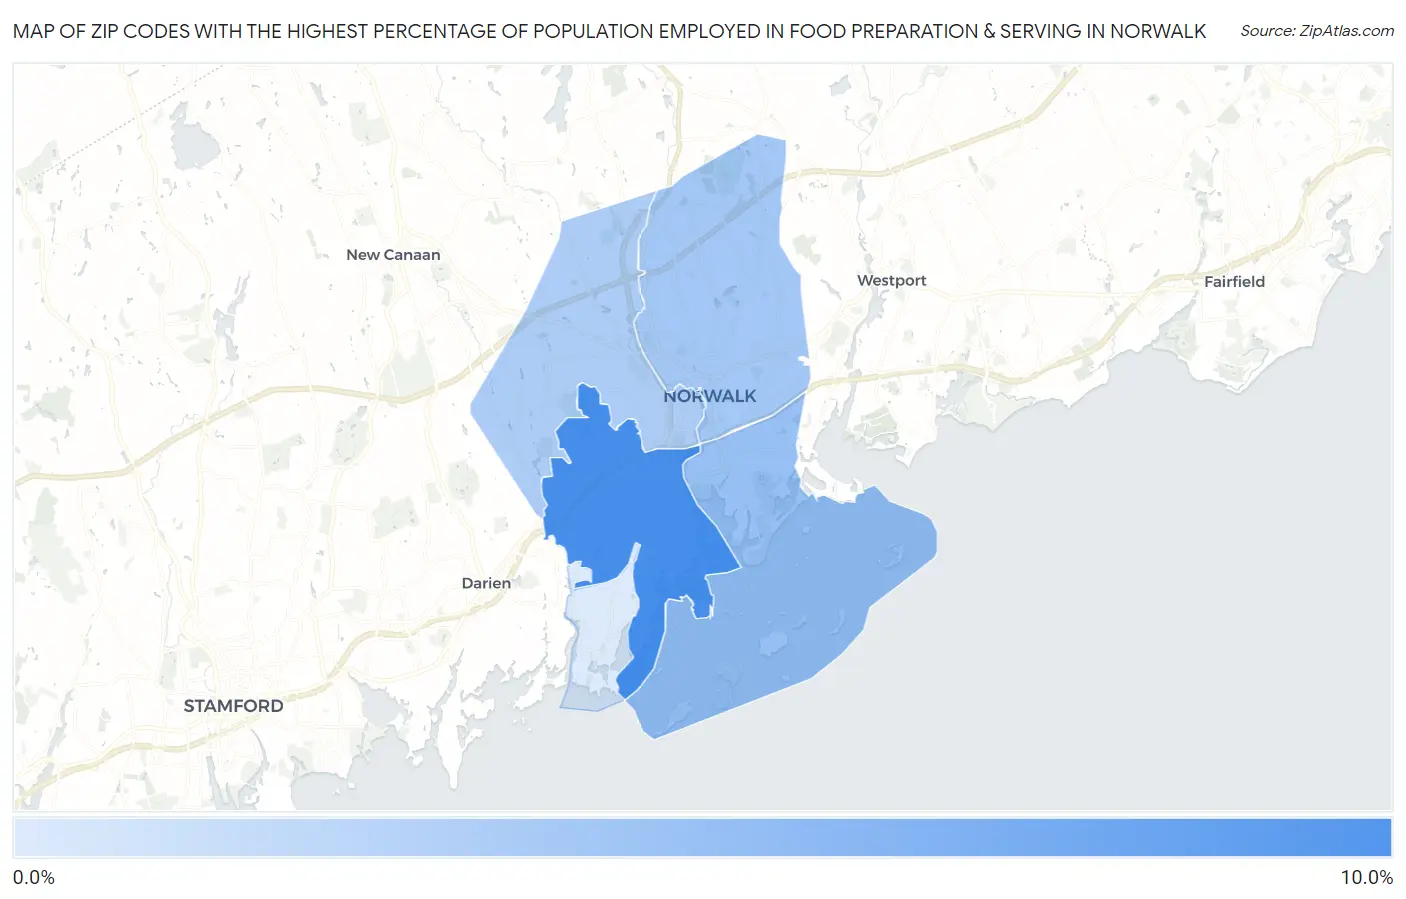
Map of Zip Codes with the Highest Percentage of Population Employed in Food Preparation & Serving in Norwalk
0.0%
10.0%
Zip Codes with the Highest Percentage of Population Employed in Food Preparation & Serving in Norwalk, CT
| Zip Code | % Employed | vs State | vs National | |
| 1. | 06854 | 9.4% | 4.7%(+4.76)#15 | 5.3%(+4.16)#3,098 |
| 2. | 06855 | 4.4% | 4.7%(-0.259)#105 | 5.3%(-0.861)#15,309 |
| 3. | 06851 | 3.7% | 4.7%(-0.994)#136 | 5.3%(-1.60)#18,400 |
| 4. | 06850 | 3.1% | 4.7%(-1.59)#170 | 5.3%(-2.19)#20,875 |
| 5. | 06853 | 0.27% | 4.7%(-4.42)#256 | 5.3%(-5.02)#27,864 |
1
Common Questions
What are the Top 3 Zip Codes with the Highest Percentage of Population Employed in Food Preparation & Serving in Norwalk, CT?
Top 3 Zip Codes with the Highest Percentage of Population Employed in Food Preparation & Serving in Norwalk, CT are:
What zip code has the Highest Percentage of Population Employed in Food Preparation & Serving in Norwalk, CT?
06854 has the Highest Percentage of Population Employed in Food Preparation & Serving in Norwalk, CT with 9.4%.
What is the Percentage of Population Employed in Food Preparation & Serving in Norwalk, CT?
Percentage of Population Employed in Food Preparation & Serving in Norwalk is 5.5%.
What is the Percentage of Population Employed in Food Preparation & Serving in Connecticut?
Percentage of Population Employed in Food Preparation & Serving in Connecticut is 4.7%.
What is the Percentage of Population Employed in Food Preparation & Serving in the United States?
Percentage of Population Employed in Food Preparation & Serving in the United States is 5.3%.