Zip Codes with the Highest Percentage of Population Employed in Food Preparation & Serving in Manchester, CT
RELATED REPORTS & OPTIONS
Food Preparation & Serving
Manchester
Compare Zip Codes
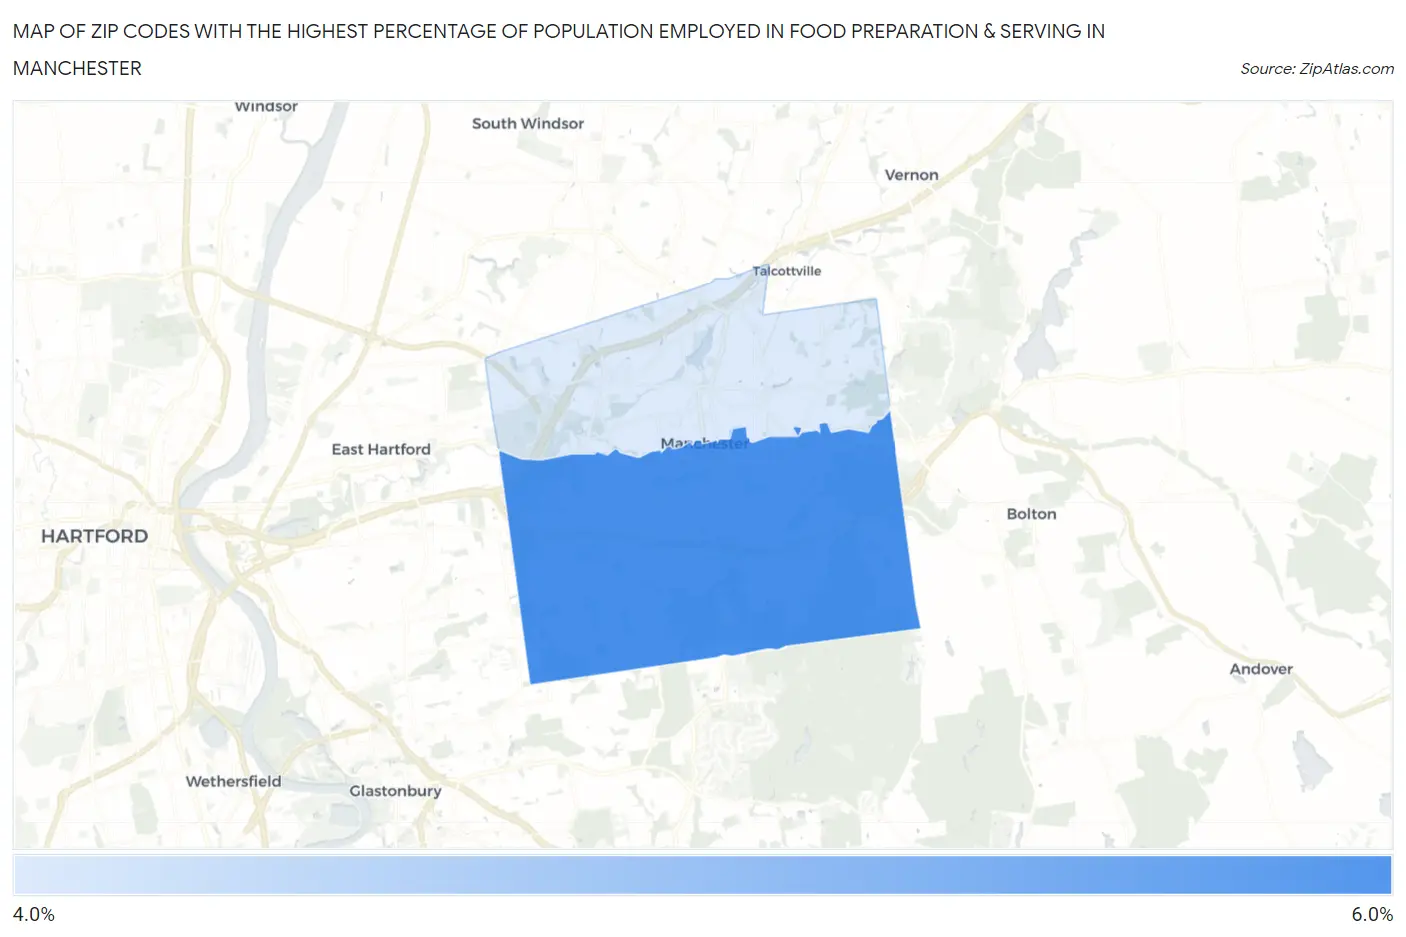
Map of Zip Codes with the Highest Percentage of Population Employed in Food Preparation & Serving in Manchester
0.0%
6.0%
Zip Codes with the Highest Percentage of Population Employed in Food Preparation & Serving in Manchester, CT
| Zip Code | % Employed | vs State | vs National | |
| 1. | 06040 | 6.0% | 4.7%(+1.27)#68 | 5.3%(+0.668)#9,494 |
| 2. | 06042 | 4.1% | 4.7%(-0.602)#118 | 5.3%(-1.20)#16,782 |
1
Common Questions
What are the Top Zip Codes with the Highest Percentage of Population Employed in Food Preparation & Serving in Manchester, CT?
Top Zip Codes with the Highest Percentage of Population Employed in Food Preparation & Serving in Manchester, CT are:
What zip code has the Highest Percentage of Population Employed in Food Preparation & Serving in Manchester, CT?
06040 has the Highest Percentage of Population Employed in Food Preparation & Serving in Manchester, CT with 6.0%.
What is the Percentage of Population Employed in Food Preparation & Serving in Manchester, CT?
Percentage of Population Employed in Food Preparation & Serving in Manchester is 6.9%.
What is the Percentage of Population Employed in Food Preparation & Serving in Connecticut?
Percentage of Population Employed in Food Preparation & Serving in Connecticut is 4.7%.
What is the Percentage of Population Employed in Food Preparation & Serving in the United States?
Percentage of Population Employed in Food Preparation & Serving in the United States is 5.3%.