Zip Codes with the Highest Percentage of Households with Income Above $100,000 in Manchester, CT
RELATED REPORTS & OPTIONS
Household Income | $100k+
Manchester
Compare Zip Codes
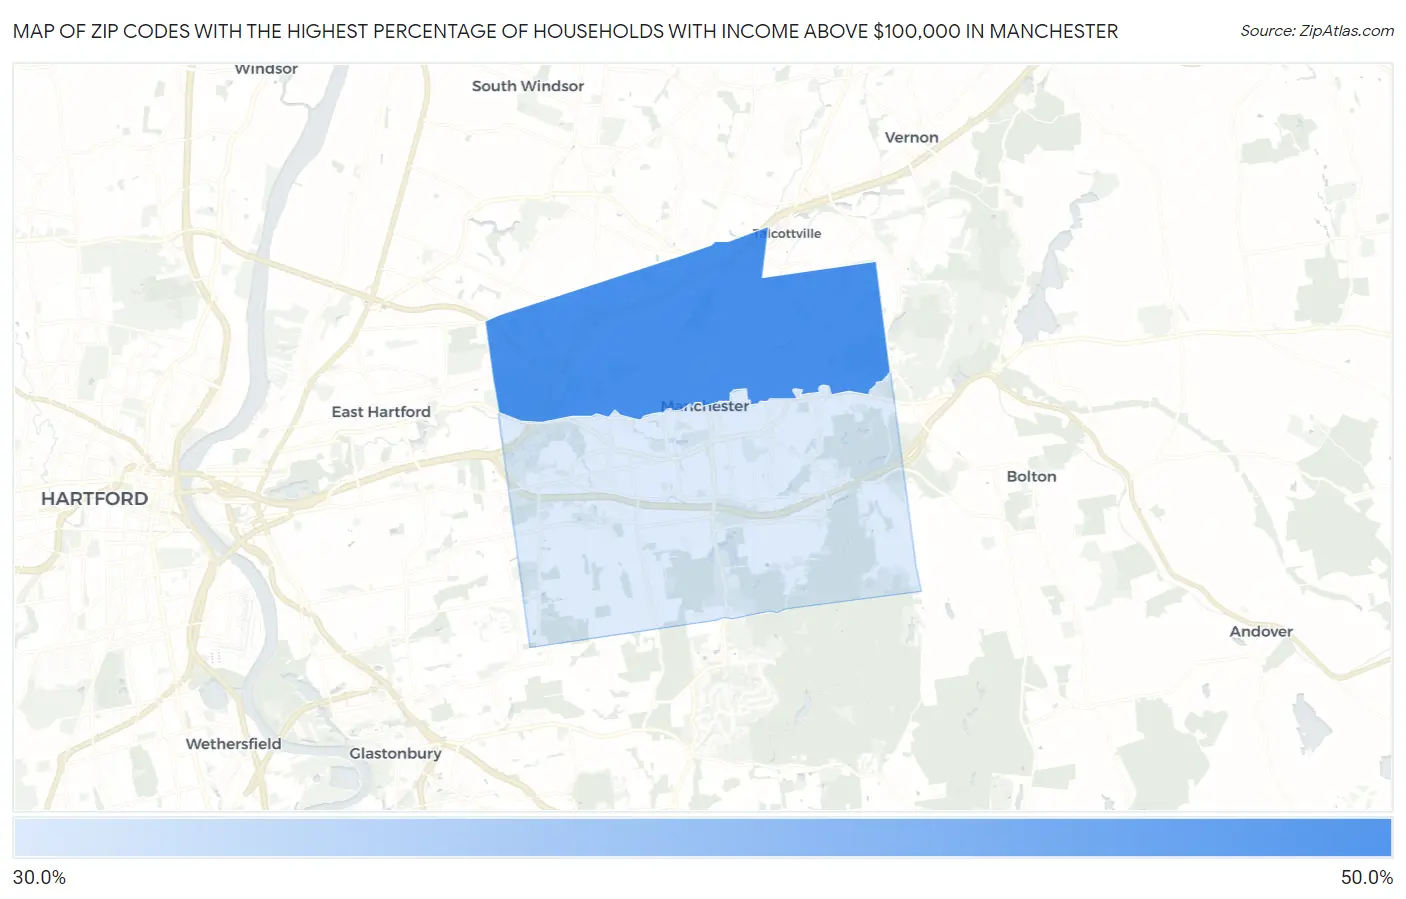
Map of Zip Codes with the Highest Percentage of Households with Income Above $100,000 in Manchester
0.0%
50.0%
Zip Codes with the Highest Percentage of Households with Income Above $100,000 in Manchester, CT
| Zip Code | Households with Income > $100k | vs State | vs National | |
| 1. | 06042 | 40.5% | 45.6%(-5.10)#205 | 37.3%(+3.20)#8,660 |
| 2. | 06040 | 37.5% | 45.6%(-8.10)#217 | 37.3%(+0.200)#10,252 |
1
Common Questions
What are the Top Zip Codes with the Highest Percentage of Households with Income Above $100,000 in Manchester, CT?
Top Zip Codes with the Highest Percentage of Households with Income Above $100,000 in Manchester, CT are:
What zip code has the Highest Percentage of Households with Income Above $100,000 in Manchester, CT?
06042 has the Highest Percentage of Households with Income Above $100,000 in Manchester, CT with 40.5%.
What is the Percentage of Households with Income Above $100,000 in Manchester, CT?
Percentage of Households with Income Above $100,000 in Manchester is 32.1%.
What is the Percentage of Households with Income Above $100,000 in Connecticut?
Percentage of Households with Income Above $100,000 in Connecticut is 45.6%.
What is the Percentage of Households with Income Above $100,000 in the United States?
Percentage of Households with Income Above $100,000 in the United States is 37.3%.