Zip Codes with the Highest Percentage of Population Employed in Utilities in Littleton, CO
RELATED REPORTS & OPTIONS
Utilities
Littleton
Compare Zip Codes
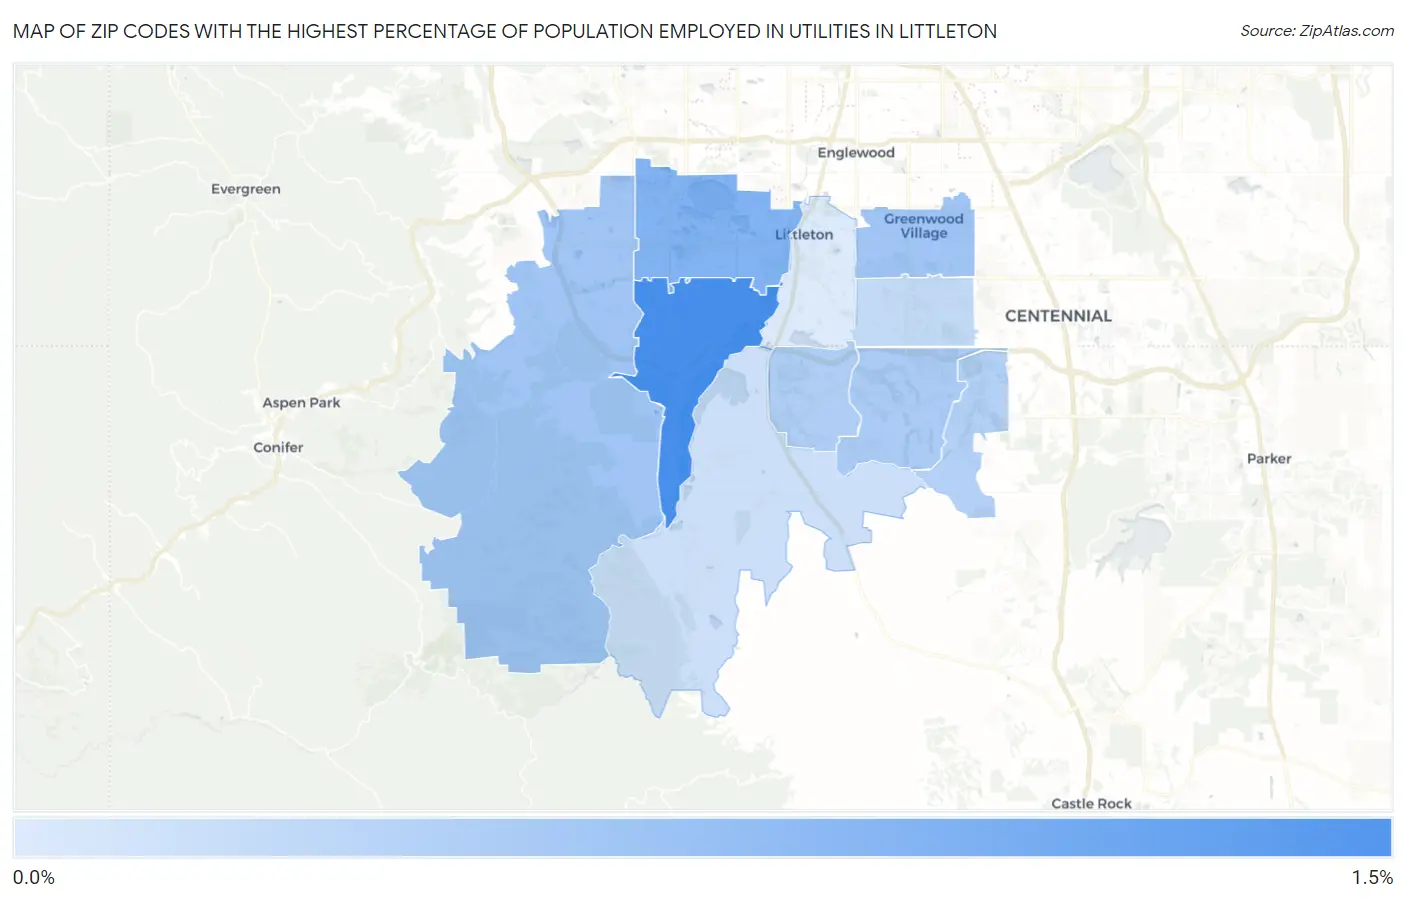
Map of Zip Codes with the Highest Percentage of Population Employed in Utilities in Littleton
0.0%
1.5%
Zip Codes with the Highest Percentage of Population Employed in Utilities in Littleton, CO
| Zip Code | % Employed | vs State | vs National | |
| 1. | 80128 | 1.5% | 0.88%(+0.605)#117 | 0.84%(+0.651)#6,898 |
| 2. | 80123 | 1.0% | 0.88%(+0.118)#176 | 0.84%(+0.164)#10,335 |
| 3. | 80121 | 0.74% | 0.88%(-0.140)#212 | 0.84%(-0.094)#13,005 |
| 4. | 80127 | 0.74% | 0.88%(-0.141)#213 | 0.84%(-0.094)#13,011 |
| 5. | 80126 | 0.66% | 0.88%(-0.222)#225 | 0.84%(-0.175)#13,959 |
| 6. | 80129 | 0.63% | 0.88%(-0.255)#234 | 0.84%(-0.209)#14,384 |
| 7. | 80130 | 0.58% | 0.88%(-0.301)#242 | 0.84%(-0.255)#14,983 |
| 8. | 80122 | 0.46% | 0.88%(-0.420)#276 | 0.84%(-0.373)#16,649 |
| 9. | 80125 | 0.38% | 0.88%(-0.499)#292 | 0.84%(-0.453)#17,772 |
| 10. | 80120 | 0.25% | 0.88%(-0.634)#316 | 0.84%(-0.587)#19,652 |
1
Common Questions
What are the Top 5 Zip Codes with the Highest Percentage of Population Employed in Utilities in Littleton, CO?
Top 5 Zip Codes with the Highest Percentage of Population Employed in Utilities in Littleton, CO are:
What zip code has the Highest Percentage of Population Employed in Utilities in Littleton, CO?
80128 has the Highest Percentage of Population Employed in Utilities in Littleton, CO with 1.5%.
What is the Percentage of Population Employed in Utilities in Littleton, CO?
Percentage of Population Employed in Utilities in Littleton is 0.25%.
What is the Percentage of Population Employed in Utilities in Colorado?
Percentage of Population Employed in Utilities in Colorado is 0.88%.
What is the Percentage of Population Employed in Utilities in the United States?
Percentage of Population Employed in Utilities in the United States is 0.84%.