Zip Codes with the Highest Percentage of Immigrants from Eastern Europe in Littleton, CO
RELATED REPORTS & OPTIONS
Eastern Europe
Littleton
Compare Zip Codes
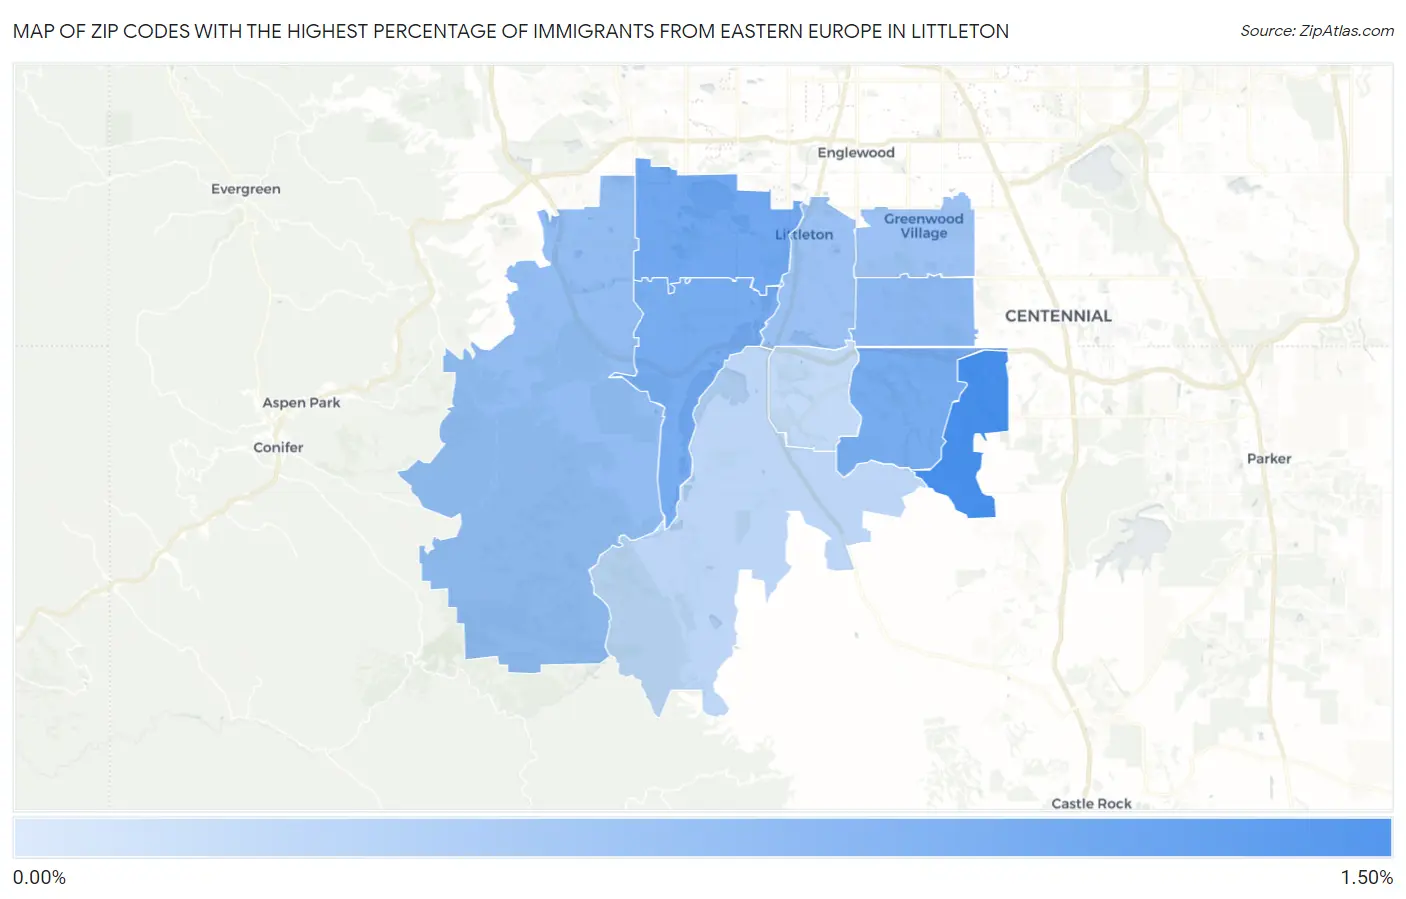
Map of Zip Codes with the Highest Percentage of Immigrants from Eastern Europe in Littleton
0.00%
1.50%
Zip Codes with the Highest Percentage of Immigrants from Eastern Europe in Littleton, CO
| Zip Code | Eastern Europe | vs State | vs National | |
| 1. | 80130 | 1.29% | 0.52%(+0.770)#22 | 0.67%(+0.624)#2,238 |
| 2. | 80123 | 0.93% | 0.52%(+0.413)#49 | 0.67%(+0.267)#3,240 |
| 3. | 80126 | 0.88% | 0.52%(+0.360)#56 | 0.67%(+0.214)#3,416 |
| 4. | 80128 | 0.88% | 0.52%(+0.356)#58 | 0.67%(+0.210)#3,436 |
| 5. | 80122 | 0.69% | 0.52%(+0.164)#79 | 0.67%(+0.019)#4,323 |
| 6. | 80127 | 0.63% | 0.52%(+0.105)#90 | 0.67%(-0.041)#4,653 |
| 7. | 80121 | 0.58% | 0.52%(+0.061)#93 | 0.67%(-0.085)#4,942 |
| 8. | 80120 | 0.56% | 0.52%(+0.034)#98 | 0.67%(-0.112)#5,110 |
| 9. | 80125 | 0.27% | 0.52%(-0.253)#161 | 0.67%(-0.399)#7,913 |
| 10. | 80129 | 0.23% | 0.52%(-0.294)#173 | 0.67%(-0.440)#8,483 |
1
Common Questions
What are the Top 5 Zip Codes with the Highest Percentage of Immigrants from Eastern Europe in Littleton, CO?
Top 5 Zip Codes with the Highest Percentage of Immigrants from Eastern Europe in Littleton, CO are:
What zip code has the Highest Percentage of Immigrants from Eastern Europe in Littleton, CO?
80130 has the Highest Percentage of Immigrants from Eastern Europe in Littleton, CO with 1.29%.
What is the Percentage of Immigrants from Eastern Europe in Littleton, CO?
Percentage of Immigrants from Eastern Europe in Littleton is 0.54%.
What is the Percentage of Immigrants from Eastern Europe in Colorado?
Percentage of Immigrants from Eastern Europe in Colorado is 0.52%.
What is the Percentage of Immigrants from Eastern Europe in the United States?
Percentage of Immigrants from Eastern Europe in the United States is 0.67%.