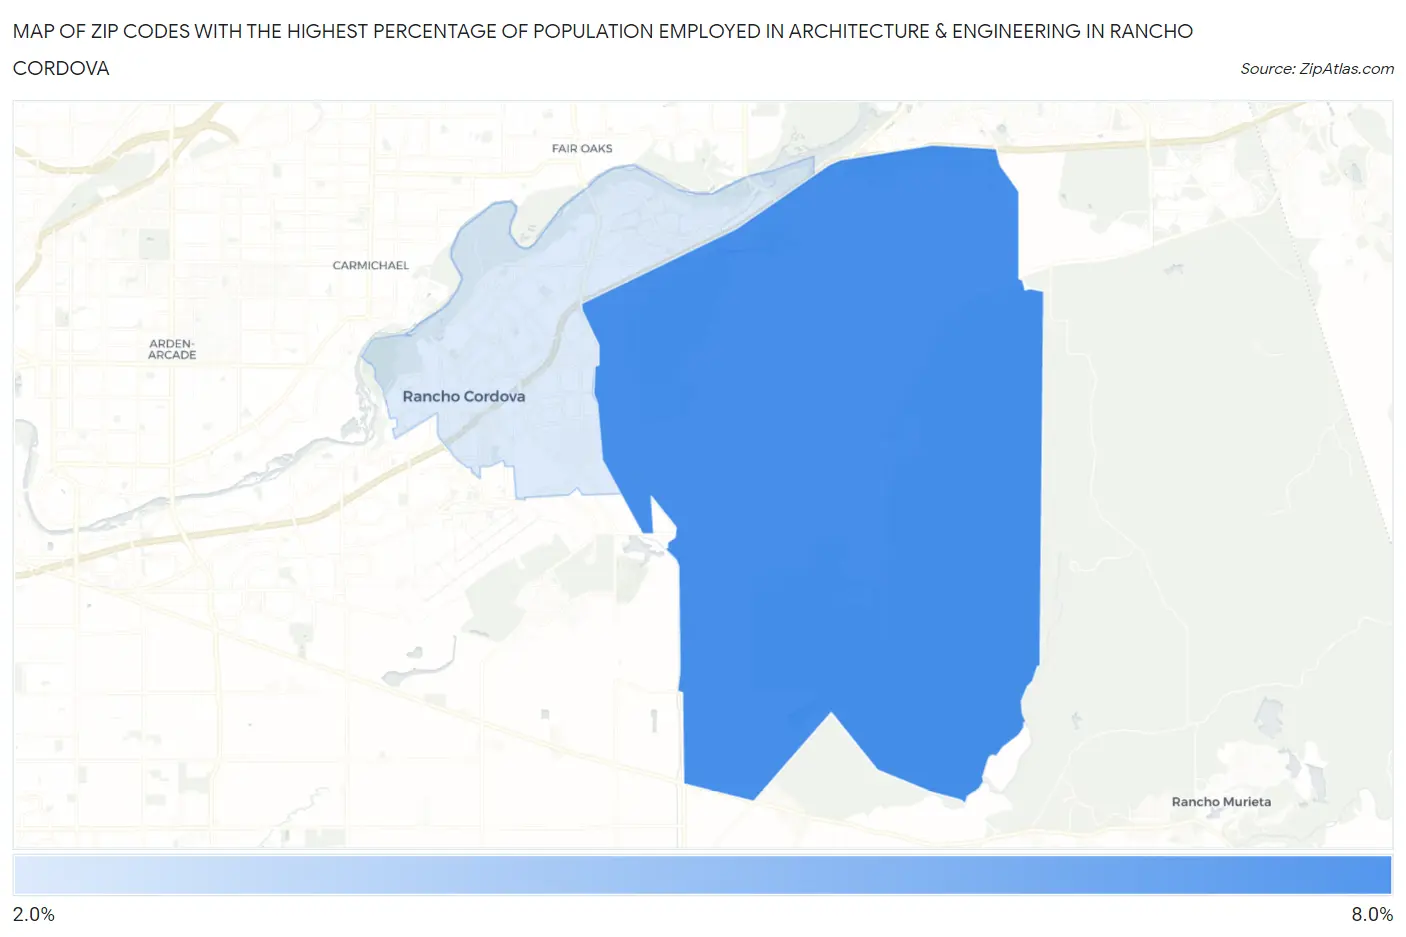
Zip Codes with the Highest Percentage of Population Employed in Architecture & Engineering in Rancho Cordova, CA
RELATED REPORTS & OPTIONS
Architecture & Engineering
Rancho Cordova
Compare Zip Codes
Map of Zip Codes with the Highest Percentage of Population Employed in Architecture & Engineering in Rancho Cordova
0.0%
8.0%
Zip Codes with the Highest Percentage of Population Employed in Architecture & Engineering in Rancho Cordova, CA
| Zip Code | % Employed | vs State | vs National | |
| 1. | 95742 | 6.2% | 2.6%(+3.61)#101 | 2.1%(+4.02)#1,014 |
| 2. | 95670 | 2.6% | 2.6%(+0.066)#495 | 2.1%(+0.471)#6,491 |
1
Common Questions
What are the Top Zip Codes with the Highest Percentage of Population Employed in Architecture & Engineering in Rancho Cordova, CA?
Top Zip Codes with the Highest Percentage of Population Employed in Architecture & Engineering in Rancho Cordova, CA are:
What zip code has the Highest Percentage of Population Employed in Architecture & Engineering in Rancho Cordova, CA?
95742 has the Highest Percentage of Population Employed in Architecture & Engineering in Rancho Cordova, CA with 6.2%.
What is the Percentage of Population Employed in Architecture & Engineering in Rancho Cordova, CA?
Percentage of Population Employed in Architecture & Engineering in Rancho Cordova is 2.8%.
What is the Percentage of Population Employed in Architecture & Engineering in California?
Percentage of Population Employed in Architecture & Engineering in California is 2.6%.
What is the Percentage of Population Employed in Architecture & Engineering in the United States?
Percentage of Population Employed in Architecture & Engineering in the United States is 2.1%.