Zip Codes with the Highest Percentage of Population Employed in Architecture & Engineering in Grass Valley, CA
RELATED REPORTS & OPTIONS
Architecture & Engineering
Grass Valley
Compare Zip Codes
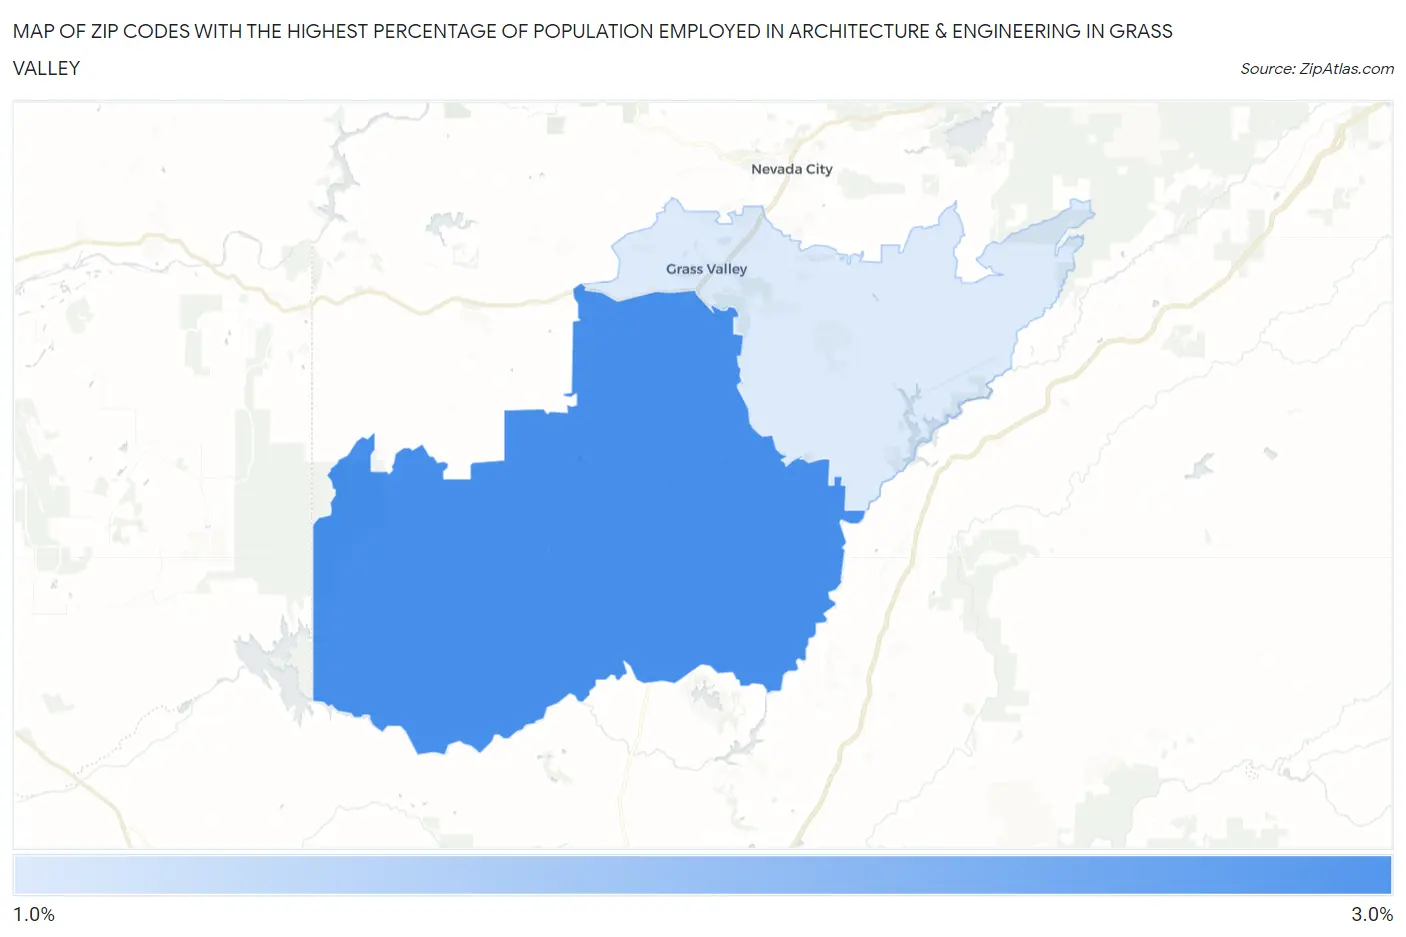
Map of Zip Codes with the Highest Percentage of Population Employed in Architecture & Engineering in Grass Valley
0.0%
3.0%
Zip Codes with the Highest Percentage of Population Employed in Architecture & Engineering in Grass Valley, CA
| Zip Code | % Employed | vs State | vs National | |
| 1. | 95949 | 2.6% | 2.6%(-0.003)#515 | 2.1%(+0.402)#6,785 |
| 2. | 95945 | 1.8% | 2.6%(-0.706)#741 | 2.1%(-0.301)#10,549 |
1
Common Questions
What are the Top Zip Codes with the Highest Percentage of Population Employed in Architecture & Engineering in Grass Valley, CA?
Top Zip Codes with the Highest Percentage of Population Employed in Architecture & Engineering in Grass Valley, CA are:
What zip code has the Highest Percentage of Population Employed in Architecture & Engineering in Grass Valley, CA?
95949 has the Highest Percentage of Population Employed in Architecture & Engineering in Grass Valley, CA with 2.6%.
What is the Percentage of Population Employed in Architecture & Engineering in Grass Valley, CA?
Percentage of Population Employed in Architecture & Engineering in Grass Valley is 1.7%.
What is the Percentage of Population Employed in Architecture & Engineering in California?
Percentage of Population Employed in Architecture & Engineering in California is 2.6%.
What is the Percentage of Population Employed in Architecture & Engineering in the United States?
Percentage of Population Employed in Architecture & Engineering in the United States is 2.1%.