Zip Codes with the Highest Percentage of Population Employed in Real Estate, Rental & Leasing in San Diego, CA
RELATED REPORTS & OPTIONS
Real Estate, Rental & Leasing
San Diego
Compare Zip Codes
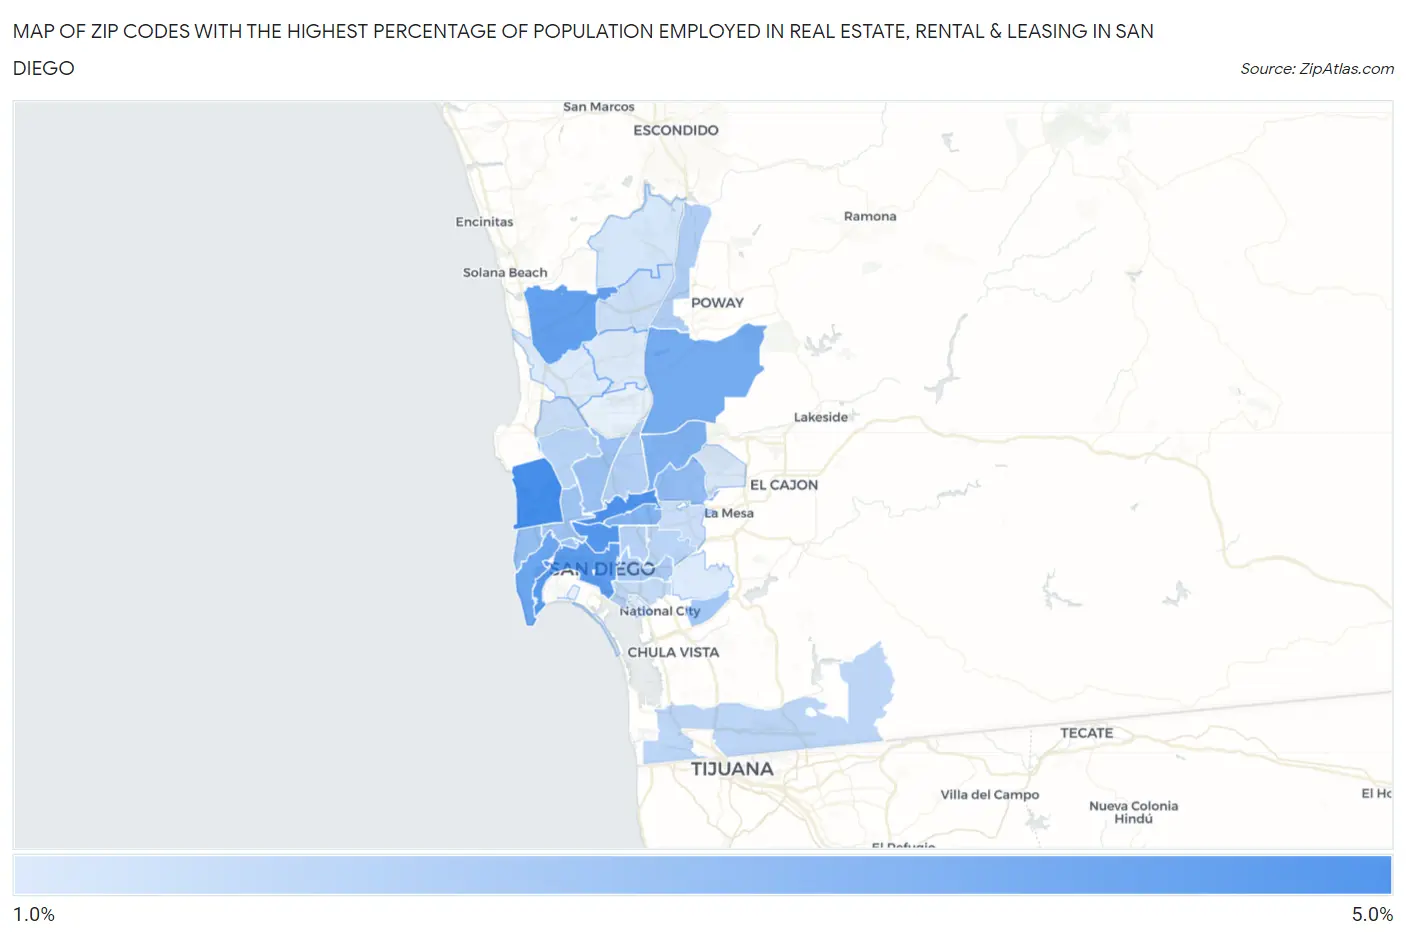
Map of Zip Codes with the Highest Percentage of Population Employed in Real Estate, Rental & Leasing in San Diego
0.0%
5.0%
Zip Codes with the Highest Percentage of Population Employed in Real Estate, Rental & Leasing in San Diego, CA
| Zip Code | % Employed | vs State | vs National | |
| 1. | 92109 | 4.4% | 2.1%(+2.27)#158 | 1.9%(+2.49)#1,801 |
| 2. | 92108 | 4.2% | 2.1%(+2.04)#175 | 1.9%(+2.27)#1,998 |
| 3. | 92103 | 4.1% | 2.1%(+1.96)#190 | 1.9%(+2.19)#2,088 |
| 4. | 92101 | 3.8% | 2.1%(+1.72)#207 | 1.9%(+1.95)#2,341 |
| 5. | 92130 | 3.8% | 2.1%(+1.68)#211 | 1.9%(+1.91)#2,389 |
| 6. | 92106 | 3.6% | 2.1%(+1.48)#242 | 1.9%(+1.71)#2,665 |
| 7. | 92131 | 3.4% | 2.1%(+1.28)#282 | 1.9%(+1.50)#3,033 |
| 8. | 92124 | 3.1% | 2.1%(+1.02)#331 | 1.9%(+1.25)#3,540 |
| 9. | 92116 | 3.1% | 2.1%(+0.973)#340 | 1.9%(+1.20)#3,639 |
| 10. | 92120 | 2.8% | 2.1%(+0.638)#411 | 1.9%(+0.866)#4,552 |
| 11. | 92107 | 2.7% | 2.1%(+0.574)#437 | 1.9%(+0.802)#4,769 |
| 12. | 92111 | 2.6% | 2.1%(+0.453)#481 | 1.9%(+0.681)#5,201 |
| 13. | 92140 | 2.5% | 2.1%(+0.417)#495 | 1.9%(+0.645)#5,347 |
| 14. | 92110 | 2.4% | 2.1%(+0.313)#525 | 1.9%(+0.541)#5,750 |
| 15. | 92139 | 2.4% | 2.1%(+0.291)#536 | 1.9%(+0.518)#5,854 |
| 16. | 92102 | 2.3% | 2.1%(+0.146)#589 | 1.9%(+0.373)#6,493 |
| 17. | 92128 | 2.2% | 2.1%(+0.032)#629 | 1.9%(+0.259)#7,068 |
| 18. | 92123 | 2.0% | 2.1%(-0.112)#698 | 1.9%(+0.116)#7,791 |
| 19. | 92104 | 1.9% | 2.1%(-0.173)#719 | 1.9%(+0.055)#8,143 |
| 20. | 92105 | 1.9% | 2.1%(-0.198)#727 | 1.9%(+0.030)#8,322 |
| 21. | 92117 | 1.9% | 2.1%(-0.216)#742 | 1.9%(+0.011)#8,444 |
| 22. | 92154 | 1.9% | 2.1%(-0.257)#763 | 1.9%(-0.030)#8,704 |
| 23. | 92113 | 1.7% | 2.1%(-0.433)#859 | 1.9%(-0.206)#9,858 |
| 24. | 92122 | 1.6% | 2.1%(-0.490)#891 | 1.9%(-0.262)#10,246 |
| 25. | 92115 | 1.6% | 2.1%(-0.555)#918 | 1.9%(-0.328)#10,687 |
| 26. | 92129 | 1.5% | 2.1%(-0.598)#932 | 1.9%(-0.371)#10,998 |
| 27. | 92127 | 1.3% | 2.1%(-0.822)#1,037 | 1.9%(-0.595)#12,744 |
| 28. | 92119 | 1.3% | 2.1%(-0.829)#1,042 | 1.9%(-0.602)#12,796 |
| 29. | 92114 | 1.2% | 2.1%(-0.932)#1,097 | 1.9%(-0.704)#13,585 |
| 30. | 92126 | 1.2% | 2.1%(-0.940)#1,100 | 1.9%(-0.712)#13,653 |
| 31. | 92121 | 1.2% | 2.1%(-0.948)#1,104 | 1.9%(-0.721)#13,732 |
1
Common Questions
What are the Top 10 Zip Codes with the Highest Percentage of Population Employed in Real Estate, Rental & Leasing in San Diego, CA?
Top 10 Zip Codes with the Highest Percentage of Population Employed in Real Estate, Rental & Leasing in San Diego, CA are:
What zip code has the Highest Percentage of Population Employed in Real Estate, Rental & Leasing in San Diego, CA?
92109 has the Highest Percentage of Population Employed in Real Estate, Rental & Leasing in San Diego, CA with 4.4%.
What is the Percentage of Population Employed in Real Estate, Rental & Leasing in San Diego, CA?
Percentage of Population Employed in Real Estate, Rental & Leasing in San Diego is 2.4%.
What is the Percentage of Population Employed in Real Estate, Rental & Leasing in California?
Percentage of Population Employed in Real Estate, Rental & Leasing in California is 2.1%.
What is the Percentage of Population Employed in Real Estate, Rental & Leasing in the United States?
Percentage of Population Employed in Real Estate, Rental & Leasing in the United States is 1.9%.