Zip Codes with the Highest Percentage of Population Employed in Security & Protection in Issaquah, WA
RELATED REPORTS & OPTIONS
Security & Protection
Issaquah
Compare Zip Codes
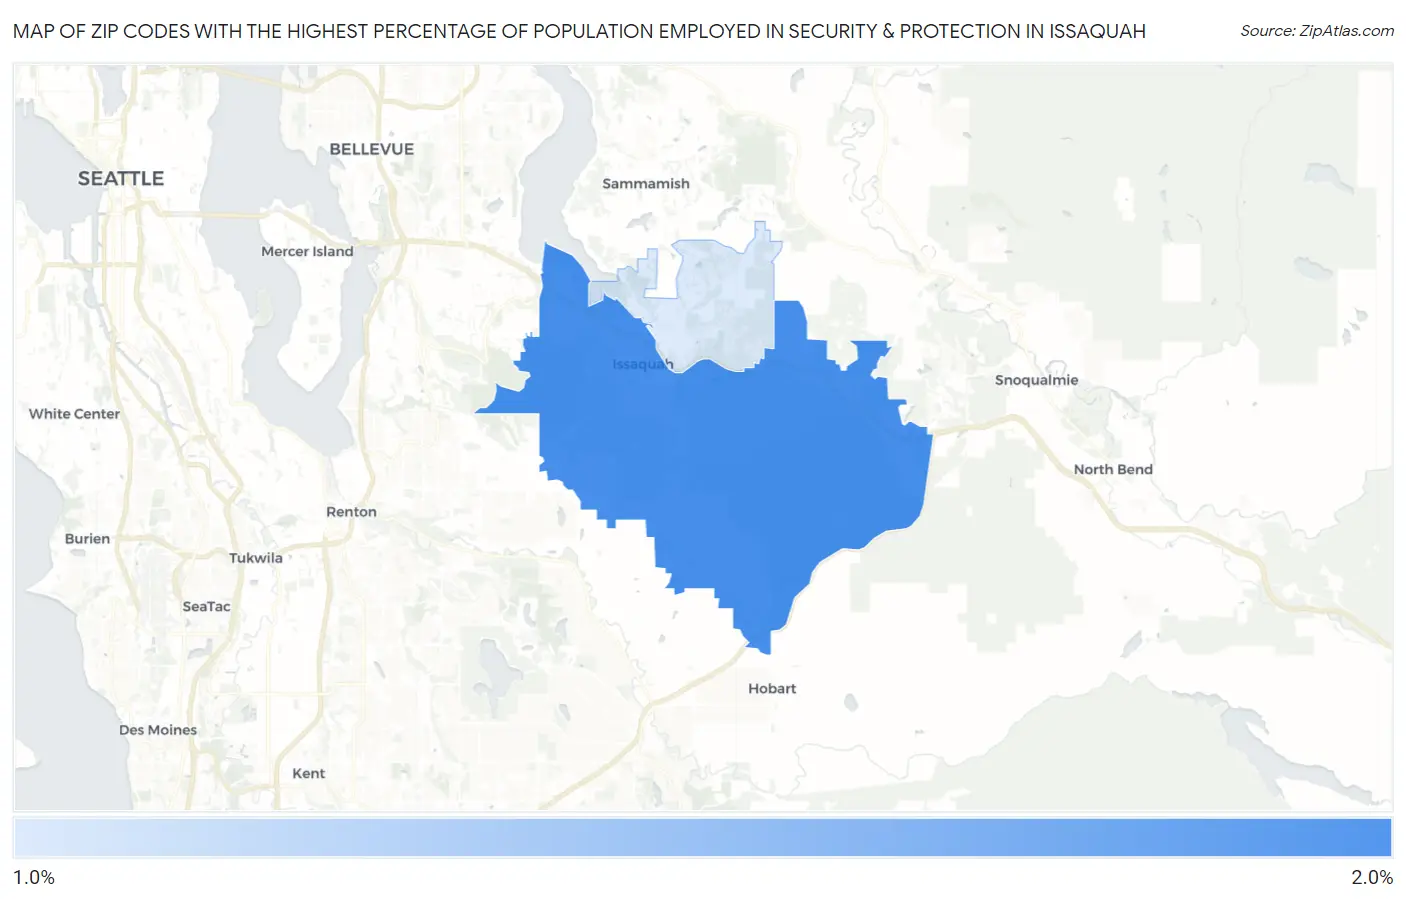
Map of Zip Codes with the Highest Percentage of Population Employed in Security & Protection in Issaquah
0.0%
2.0%
Zip Codes with the Highest Percentage of Population Employed in Security & Protection in Issaquah, WA
| Zip Code | % Employed | vs State | vs National | |
| 1. | 98027 | 1.7% | 1.8%(-0.109)#285 | 2.1%(-0.444)#14,650 |
| 2. | 98029 | 1.3% | 1.8%(-0.511)#339 | 2.1%(-0.846)#17,710 |
1
Common Questions
What are the Top Zip Codes with the Highest Percentage of Population Employed in Security & Protection in Issaquah, WA?
Top Zip Codes with the Highest Percentage of Population Employed in Security & Protection in Issaquah, WA are:
What zip code has the Highest Percentage of Population Employed in Security & Protection in Issaquah, WA?
98027 has the Highest Percentage of Population Employed in Security & Protection in Issaquah, WA with 1.7%.
What is the Percentage of Population Employed in Security & Protection in Issaquah, WA?
Percentage of Population Employed in Security & Protection in Issaquah is 1.8%.
What is the Percentage of Population Employed in Security & Protection in Washington?
Percentage of Population Employed in Security & Protection in Washington is 1.8%.
What is the Percentage of Population Employed in Security & Protection in the United States?
Percentage of Population Employed in Security & Protection in the United States is 2.1%.