Zip Codes with the Highest Percentage of Population Employed in Security & Protection in Marysville, WA
RELATED REPORTS & OPTIONS
Security & Protection
Marysville
Compare Zip Codes
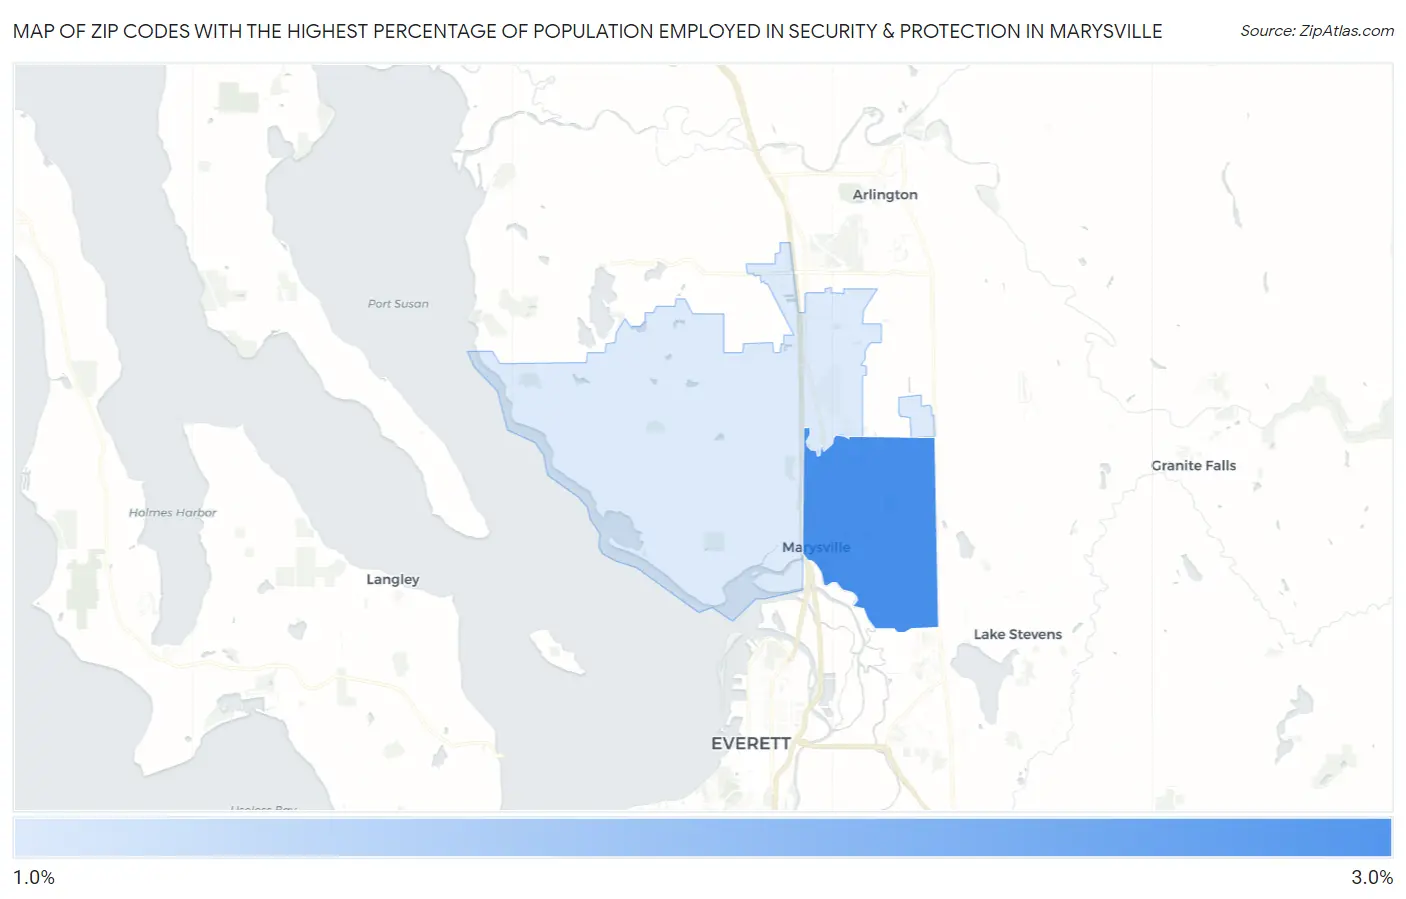
Map of Zip Codes with the Highest Percentage of Population Employed in Security & Protection in Marysville
0.0%
3.0%
Zip Codes with the Highest Percentage of Population Employed in Security & Protection in Marysville, WA
| Zip Code | % Employed | vs State | vs National | |
| 1. | 98270 | 2.7% | 1.8%(+0.865)#149 | 2.1%(+0.530)#8,641 |
| 2. | 98271 | 1.9% | 1.8%(+0.114)#243 | 2.1%(-0.221)#13,033 |
1
Common Questions
What are the Top Zip Codes with the Highest Percentage of Population Employed in Security & Protection in Marysville, WA?
Top Zip Codes with the Highest Percentage of Population Employed in Security & Protection in Marysville, WA are:
What zip code has the Highest Percentage of Population Employed in Security & Protection in Marysville, WA?
98270 has the Highest Percentage of Population Employed in Security & Protection in Marysville, WA with 2.7%.
What is the Percentage of Population Employed in Security & Protection in Marysville, WA?
Percentage of Population Employed in Security & Protection in Marysville is 2.2%.
What is the Percentage of Population Employed in Security & Protection in Washington?
Percentage of Population Employed in Security & Protection in Washington is 1.8%.
What is the Percentage of Population Employed in Security & Protection in the United States?
Percentage of Population Employed in Security & Protection in the United States is 2.1%.