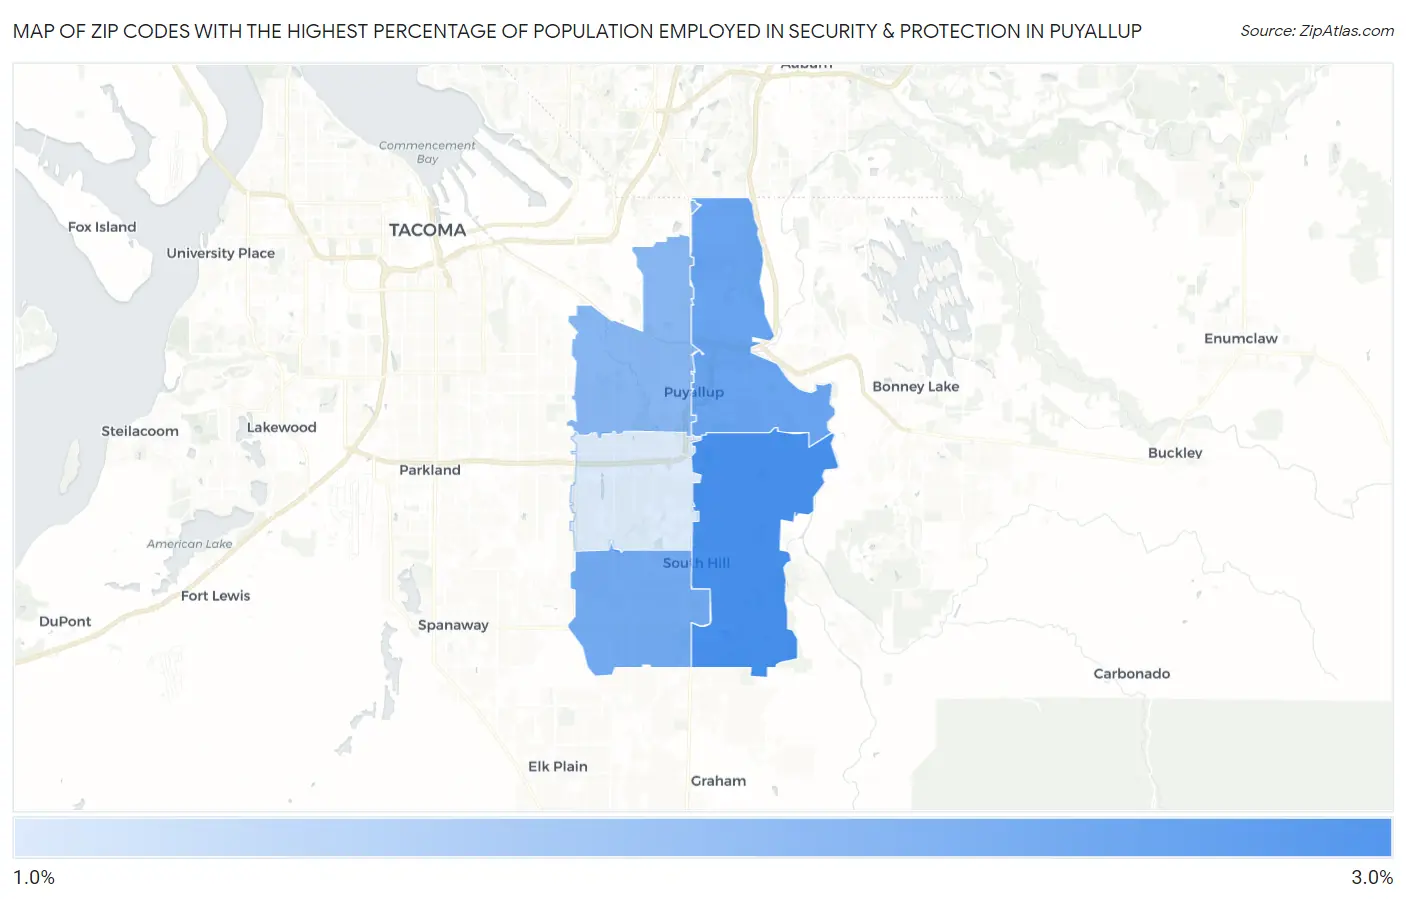
Zip Codes with the Highest Percentage of Population Employed in Security & Protection in Puyallup, WA
RELATED REPORTS & OPTIONS
Security & Protection
Puyallup
Compare Zip Codes
Map of Zip Codes with the Highest Percentage of Population Employed in Security & Protection in Puyallup
0.0%
3.0%
Zip Codes with the Highest Percentage of Population Employed in Security & Protection in Puyallup, WA
| Zip Code | % Employed | vs State | vs National | |
| 1. | 98374 | 2.6% | 1.8%(+0.807)#152 | 2.1%(+0.472)#8,910 |
| 2. | 98372 | 2.4% | 1.8%(+0.548)#178 | 2.1%(+0.213)#10,274 |
| 3. | 98375 | 2.3% | 1.8%(+0.494)#189 | 2.1%(+0.159)#10,600 |
| 4. | 98371 | 2.1% | 1.8%(+0.332)#210 | 2.1%(-0.003)#11,605 |
| 5. | 98373 | 1.5% | 1.8%(-0.284)#302 | 2.1%(-0.619)#15,951 |
1
Common Questions
What are the Top 3 Zip Codes with the Highest Percentage of Population Employed in Security & Protection in Puyallup, WA?
Top 3 Zip Codes with the Highest Percentage of Population Employed in Security & Protection in Puyallup, WA are:
What zip code has the Highest Percentage of Population Employed in Security & Protection in Puyallup, WA?
98374 has the Highest Percentage of Population Employed in Security & Protection in Puyallup, WA with 2.6%.
What is the Percentage of Population Employed in Security & Protection in Puyallup, WA?
Percentage of Population Employed in Security & Protection in Puyallup is 1.7%.
What is the Percentage of Population Employed in Security & Protection in Washington?
Percentage of Population Employed in Security & Protection in Washington is 1.8%.
What is the Percentage of Population Employed in Security & Protection in the United States?
Percentage of Population Employed in Security & Protection in the United States is 2.1%.