Icelander vs Seminole 3 or more Vehicles in Household
COMPARE
Icelander
Seminole
3 or more Vehicles in Household
3 or more Vehicles in Household Comparison
Icelanders
Seminole
21.5%
3 OR MORE VEHICLES IN HOUSEHOLD
99.6/ 100
METRIC RATING
84th/ 347
METRIC RANK
20.9%
3 OR MORE VEHICLES IN HOUSEHOLD
97.8/ 100
METRIC RATING
102nd/ 347
METRIC RANK
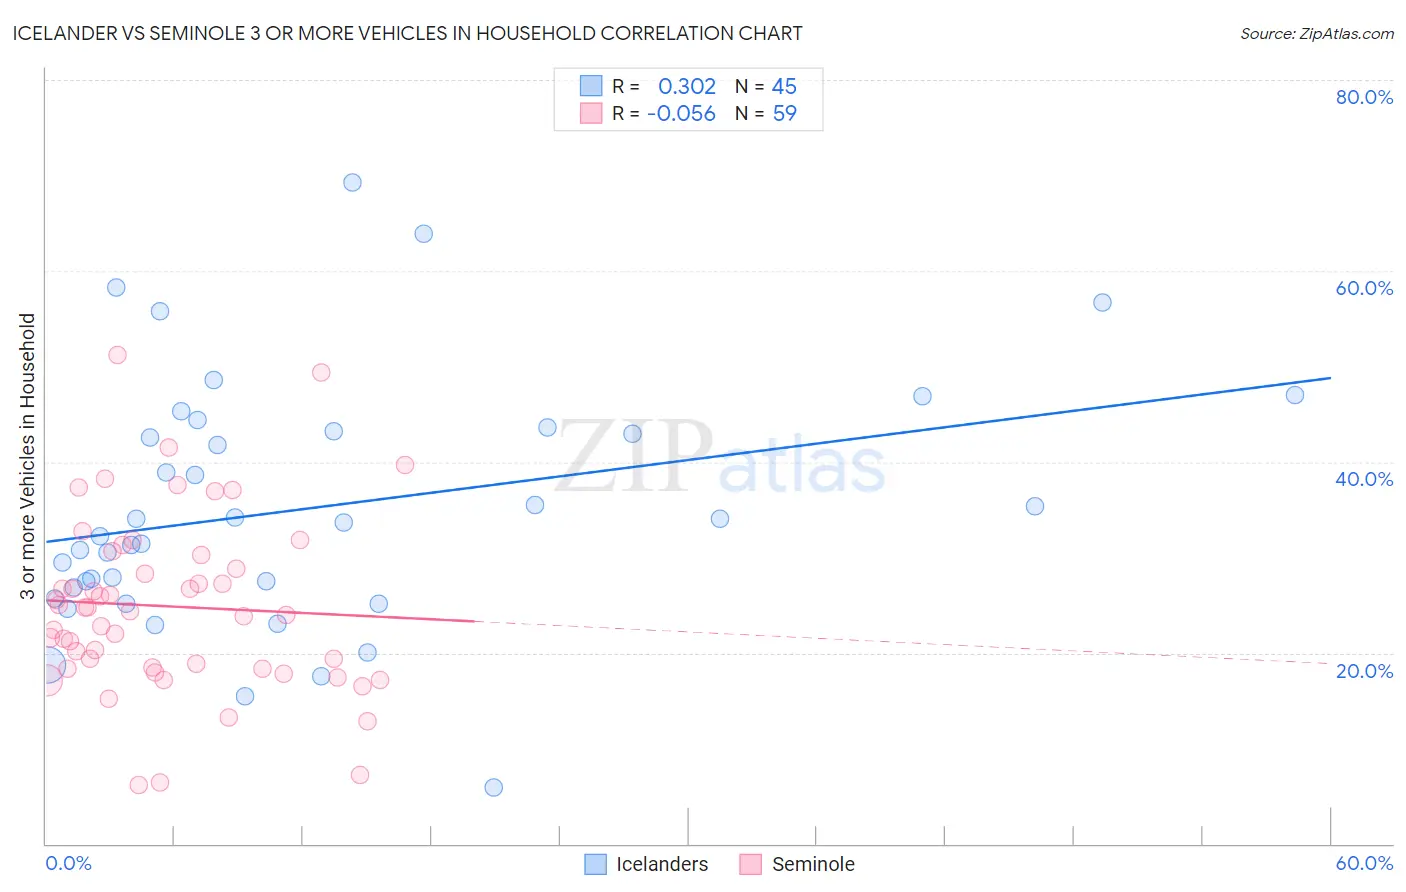
Icelander vs Seminole 3 or more Vehicles in Household Correlation Chart
The statistical analysis conducted on geographies consisting of 159,607,768 people shows a mild positive correlation between the proportion of Icelanders and percentage of households with 3 or more vehicles available in the United States with a correlation coefficient (R) of 0.302 and weighted average of 21.5%. Similarly, the statistical analysis conducted on geographies consisting of 118,297,727 people shows a slight negative correlation between the proportion of Seminole and percentage of households with 3 or more vehicles available in the United States with a correlation coefficient (R) of -0.056 and weighted average of 20.9%, a difference of 2.9%.
3 or more Vehicles in Household Correlation Summary
| Measurement | Icelander | Seminole |
| Minimum | 5.9% | 6.1% |
| Maximum | 69.2% | 51.2% |
| Range | 63.3% | 45.1% |
| Mean | 35.2% | 24.9% |
| Median | 33.7% | 24.4% |
| Interquartile 25% (IQ1) | 26.2% | 18.4% |
| Interquartile 75% (IQ3) | 43.5% | 30.3% |
| Interquartile Range (IQR) | 17.2% | 11.9% |
| Standard Deviation (Sample) | 13.1% | 9.3% |
| Standard Deviation (Population) | 12.9% | 9.2% |
Demographics Similar to Icelanders and Seminole by 3 or more Vehicles in Household
In terms of 3 or more vehicles in household, the demographic groups most similar to Icelanders are Laotian (21.5%, a difference of 0.010%), Chippewa (21.5%, a difference of 0.050%), Delaware (21.5%, a difference of 0.090%), Immigrants from the Azores (21.5%, a difference of 0.21%), and French (21.4%, a difference of 0.47%). Similarly, the demographic groups most similar to Seminole are Blackfeet (20.9%, a difference of 0.030%), Dutch West Indian (20.9%, a difference of 0.040%), Comanche (21.0%, a difference of 0.34%), Hmong (21.0%, a difference of 0.38%), and Alaska Native (21.0%, a difference of 0.38%).
| Demographics | Rating | Rank | 3 or more Vehicles in Household |
| Chippewa | 99.6 /100 | #83 | Exceptional 21.5% |
| Icelanders | 99.6 /100 | #84 | Exceptional 21.5% |
| Laotians | 99.6 /100 | #85 | Exceptional 21.5% |
| Delaware | 99.6 /100 | #86 | Exceptional 21.5% |
| Immigrants | Azores | 99.5 /100 | #87 | Exceptional 21.5% |
| French | 99.4 /100 | #88 | Exceptional 21.4% |
| Marshallese | 99.2 /100 | #89 | Exceptional 21.3% |
| Immigrants | Afghanistan | 99.1 /100 | #90 | Exceptional 21.2% |
| Belgians | 98.9 /100 | #91 | Exceptional 21.2% |
| Apache | 98.9 /100 | #92 | Exceptional 21.2% |
| Immigrants | Indonesia | 98.8 /100 | #93 | Exceptional 21.1% |
| Immigrants | Cambodia | 98.6 /100 | #94 | Exceptional 21.1% |
| Pakistanis | 98.5 /100 | #95 | Exceptional 21.0% |
| Cree | 98.4 /100 | #96 | Exceptional 21.0% |
| Canadians | 98.3 /100 | #97 | Exceptional 21.0% |
| Hmong | 98.2 /100 | #98 | Exceptional 21.0% |
| Alaska Natives | 98.2 /100 | #99 | Exceptional 21.0% |
| Comanche | 98.2 /100 | #100 | Exceptional 21.0% |
| Blackfeet | 97.9 /100 | #101 | Exceptional 20.9% |
| Seminole | 97.8 /100 | #102 | Exceptional 20.9% |
| Dutch West Indians | 97.8 /100 | #103 | Exceptional 20.9% |