Delaware vs Immigrants from Iran 1 or more Vehicles in Household

COMPARE

Delaware
Race
Ancestry
AfghanAfricanAlaska NativeAlaskan AthabascanAlbanianAleutAlsatianAmericanApacheArabArapahoArgentineanArmenianAssyrian/Chaldean/SyriacAustralianAustrianBahamianBangladeshiBarbadianBasqueBelgianBelizeanBermudanBhutaneseBlackfeetBolivianBrazilianBritishBritish West IndianBulgarianBurmeseCajunCambodianCanadianCape VerdeanCarpatho RusynCelticCentral AmericanCentral American IndianCherokeeCheyenneChickasawChileanChineseChippewaChoctawColombianColvilleComancheCosta RicanCreeCreekCroatianCrowCubanCypriotCzechCzechoslovakianDanishDelawareDominicanDutchDutch West IndianEastern EuropeanEcuadorianEgyptianEnglishEstonianEthiopianEuropeanFijianFilipinoFinnishFrenchFrench American IndianFrench CanadianGermanGerman RussianGhanaianGreekGuamanian/ChamorroGuatemalanGuyaneseHaitianHmongHonduranHopiHoumaHungarianIcelanderIndian (Asian)IndonesianInupiatIranianIraqiIrishIroquoisIsraeliItalianJamaicanJapaneseJordanianKenyanKiowaKoreanLaotianLatvianLebaneseLiberianLithuanianLumbeeLuxembourgerMacedonianMalaysianMalteseMarshalleseMenomineeMexicanMexican American IndianMongolianMoroccanNative HawaiianNavajoNepaleseNew ZealanderNicaraguanNigerianNorthern EuropeanNorwegianOkinawanOsageOttawaPaiutePakistaniPalestinianPanamanianParaguayanPennsylvania GermanPeruvianPimaPolishPortuguesePotawatomiPuebloPuerto RicanPuget Sound SalishRomanianRussianSalvadoranSamoanScandinavianScotch-IrishScottishSeminoleSenegaleseSerbianShoshoneSierra LeoneanSiouxSlavicSlovakSloveneSomaliSouth AfricanSouth AmericanSouth American IndianSoviet UnionSpaniardSpanishSpanish AmericanSpanish American IndianSri LankanSubsaharan AfricanSudaneseSwedishSwissSyrianTaiwaneseThaiTlingit-HaidaTohono O'OdhamTonganTrinidadian and TobagonianTsimshianTurkishU.S. Virgin IslanderUgandanUkrainianUruguayanUteVenezuelanVietnameseWelshWest IndianYakamaYaquiYugoslavianYumanYup'ikZimbabwean
Immigration
NonimmigrantsImmigrantsAfghanistanAfricaAlbaniaArgentinaArmeniaAsiaAustraliaAustriaBahamasBangladeshBarbadosBelarusBelgiumBelizeBoliviaBosnia and HerzegovinaBrazilBulgariaBurma/MyanmarCabo VerdeCambodiaCameroonCanadaCaribbeanCentral AmericaChileChinaColombiaCongoCosta RicaCroatiaCubaCzechoslovakiaDenmarkDominicaDominican RepublicEastern AfricaEastern AsiaEastern EuropeEcuadorEgyptEl SalvadorEnglandEritreaEthiopiaEuropeFijiFranceGermanyGhanaGreeceGrenadaGuatemalaGuyanaHaitiHondurasHong KongHungaryIndiaIndonesiaIraqIrelandIsraelItalyJamaicaJapanJordanKazakhstanKenyaKoreaKuwaitLaosLatin AmericaLatviaLebanonLiberiaLithuaniaMalaysiaMexicoMicronesiaMiddle AfricaMoldovaMoroccoNepalNetherlandsNicaraguaNigeriaNorth AmericaNorth MacedoniaNorthern AfricaNorthern EuropeNorwayOceaniaPakistanPanamaPeruPhilippinesPolandPortugalRomaniaRussiaSaudi ArabiaScotlandSenegalSerbiaSierra LeoneSingaporeSomaliaSouth AfricaSouth AmericaSouth Central AsiaSouth Eastern AsiaSouthern EuropeSpainSri LankaSt. Vincent and the GrenadinesSudanSwedenSwitzerlandSyriaTaiwanThailandTrinidad and TobagoTurkeyUgandaUkraineUruguayUzbekistanVenezuelaVietnamWest IndiesWestern AfricaWestern AsiaWestern EuropeYemenZaireZimbabweAzores
Immigrants from Iran
Race
Ancestry
AfghanAfricanAlaska NativeAlaskan AthabascanAlbanianAleutAlsatianAmericanApacheArabArapahoArgentineanArmenianAssyrian/Chaldean/SyriacAustralianAustrianBahamianBangladeshiBarbadianBasqueBelgianBelizeanBermudanBhutaneseBlackfeetBolivianBrazilianBritishBritish West IndianBulgarianBurmeseCajunCambodianCanadianCape VerdeanCarpatho RusynCelticCentral AmericanCentral American IndianCherokeeCheyenneChickasawChileanChineseChippewaChoctawColombianColvilleComancheCosta RicanCreeCreekCroatianCrowCubanCypriotCzechCzechoslovakianDanishDominicanDutchDutch West IndianEastern EuropeanEcuadorianEgyptianEnglishEstonianEthiopianEuropeanFijianFilipinoFinnishFrenchFrench American IndianFrench CanadianGermanGerman RussianGhanaianGreekGuamanian/ChamorroGuatemalanGuyaneseHaitianHmongHonduranHopiHoumaHungarianIcelanderIndian (Asian)IndonesianInupiatIranianIraqiIrishIroquoisIsraeliItalianJamaicanJapaneseJordanianKenyanKiowaKoreanLaotianLatvianLebaneseLiberianLithuanianLumbeeLuxembourgerMacedonianMalaysianMalteseMarshalleseMenomineeMexicanMexican American IndianMongolianMoroccanNative HawaiianNavajoNepaleseNew ZealanderNicaraguanNigerianNorthern EuropeanNorwegianOkinawanOsageOttawaPaiutePakistaniPalestinianPanamanianParaguayanPennsylvania GermanPeruvianPimaPolishPortuguesePotawatomiPuebloPuerto RicanPuget Sound SalishRomanianRussianSalvadoranSamoanScandinavianScotch-IrishScottishSeminoleSenegaleseSerbianShoshoneSierra LeoneanSiouxSlavicSlovakSloveneSomaliSouth AfricanSouth AmericanSouth American IndianSoviet UnionSpaniardSpanishSpanish AmericanSpanish American IndianSri LankanSubsaharan AfricanSudaneseSwedishSwissSyrianTaiwaneseThaiTlingit-HaidaTohono O'OdhamTonganTrinidadian and TobagonianTsimshianTurkishU.S. Virgin IslanderUgandanUkrainianUruguayanUteVenezuelanVietnameseWelshWest IndianYakamaYaquiYugoslavianYumanYup'ikZimbabwean
Immigration
NonimmigrantsImmigrantsAfghanistanAfricaAlbaniaArgentinaArmeniaAsiaAustraliaAustriaBahamasBangladeshBarbadosBelarusBelgiumBelizeBoliviaBosnia and HerzegovinaBrazilBulgariaBurma/MyanmarCabo VerdeCambodiaCameroonCanadaCaribbeanCentral AmericaChileChinaColombiaCongoCosta RicaCroatiaCubaCzechoslovakiaDenmarkDominicaDominican RepublicEastern AfricaEastern AsiaEastern EuropeEcuadorEgyptEl SalvadorEnglandEritreaEthiopiaEuropeFijiFranceGermanyGhanaGreeceGrenadaGuatemalaGuyanaHaitiHondurasHong KongHungaryIndiaIndonesiaIranIraqIrelandIsraelItalyJamaicaJapanJordanKazakhstanKenyaKoreaKuwaitLaosLatin AmericaLatviaLebanonLiberiaLithuaniaMalaysiaMexicoMicronesiaMiddle AfricaMoldovaMoroccoNepalNetherlandsNicaraguaNigeriaNorth AmericaNorth MacedoniaNorthern AfricaNorthern EuropeNorwayOceaniaPakistanPanamaPeruPhilippinesPolandPortugalRomaniaRussiaSaudi ArabiaScotlandSenegalSerbiaSierra LeoneSingaporeSomaliaSouth AfricaSouth AmericaSouth Central AsiaSouth Eastern AsiaSouthern EuropeSpainSri LankaSt. Vincent and the GrenadinesSudanSwedenSwitzerlandSyriaTaiwanThailandTrinidad and TobagoTurkeyUgandaUkraineUruguayUzbekistanVenezuelaVietnamWest IndiesWestern AfricaWestern AsiaWestern EuropeYemenZaireZimbabweAzores
1 or more Vehicles in Household
Income
Poverty
Unemployment
Labor Participation
Family Structure
Vehicle Availability
Education Level
Disability

1 or more Vehicles in Household Comparison

Delaware

Immigrants from Iran

Exceptional
Exceptional
91.0%
1 OR MORE VEHICLES IN HOUSEHOLD
97.6/ 100
METRIC RATING
109th/ 347
METRIC RANK
91.7%
1 OR MORE VEHICLES IN HOUSEHOLD
99.7/ 100
METRIC RATING
73rd/ 347
METRIC RANK

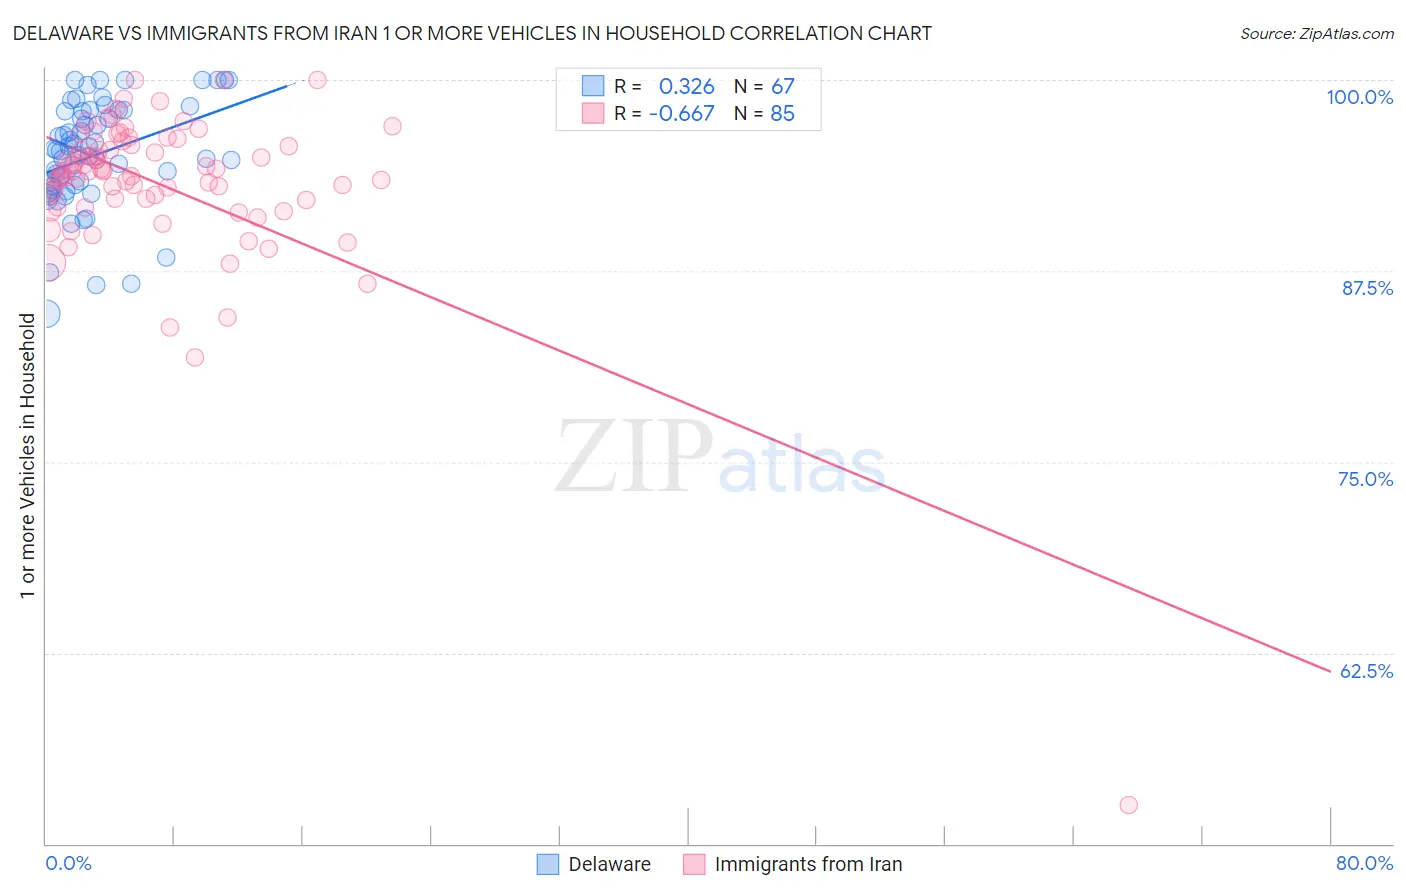
Delaware vs Immigrants from Iran 1 or more Vehicles in Household Correlation Chart

The statistical analysis conducted on geographies consisting of 96,231,317 people shows a mild positive correlation between the proportion of Delaware and percentage of households with 1 or more vehicles available in the United States with a correlation coefficient (R) of 0.326 and weighted average of 91.0%. Similarly, the statistical analysis conducted on geographies consisting of 279,849,104 people shows a significant negative correlation between the proportion of Immigrants from Iran and percentage of households with 1 or more vehicles available in the United States with a correlation coefficient (R) of -0.667 and weighted average of 91.7%, a difference of 0.75%.
Delaware vs Immigrants from Iran 1 or more Vehicles in Household

1 or more Vehicles in Household Correlation Summary

MeasurementDelawareImmigrants from Iran
Minimum84.7%52.6%
Maximum100.0%100.0%
Range15.3%47.4%
Mean95.1%93.2%
Median95.4%94.0%
Interquartile 25% (IQ1)93.1%91.9%
Interquartile 75% (IQ3)98.0%95.9%
Interquartile Range (IQR)4.9%4.0%
Standard Deviation (Sample)3.5%5.6%
Standard Deviation (Population)3.5%5.6%

Similar Demographics by 1 or more Vehicles in Household

Demographics Similar to Delaware by 1 or more Vehicles in Household

In terms of 1 or more vehicles in household, the demographic groups most similar to Delaware are Hispanic or Latino (91.0%, a difference of 0.0%), Maltese (91.0%, a difference of 0.010%), Zimbabwean (91.0%, a difference of 0.020%), Mexican American Indian (91.0%, a difference of 0.030%), and Laotian (91.0%, a difference of 0.070%).
DemographicsRating | Rank1 or more Vehicles in Household
Seminole
98.3
/100
|
#102
Exceptional
91.1%
Yugoslavians
98.3
/100
|
#103
Exceptional
91.1%
Asians
98.2
/100
|
#104
Exceptional
91.1%
Laotians
98.0
/100
|
#105
Exceptional
91.0%
Zimbabweans
97.7
/100
|
#106
Exceptional
91.0%
Maltese
97.7
/100
|
#107
Exceptional
91.0%
Hispanics or Latinos
97.6
/100
|
#108
Exceptional
91.0%
Delaware
97.6
/100
|
#109
Exceptional
91.0%
Mexican American Indians
97.4
/100
|
#110
Exceptional
91.0%
Navajo
95.8
/100
|
#111
Exceptional
90.8%
Immigrants | Netherlands
95.7
/100
|
#112
Exceptional
90.8%
Immigrants | Kuwait
94.7
/100
|
#113
Exceptional
90.7%
Armenians
94.5
/100
|
#114
Exceptional
90.7%
Serbians
94.3
/100
|
#115
Exceptional
90.7%
Chippewa
94.3
/100
|
#116
Exceptional
90.7%

Demographics Similar to Immigrants from Iran by 1 or more Vehicles in Household

In terms of 1 or more vehicles in household, the demographic groups most similar to Immigrants from Iran are Polish (91.7%, a difference of 0.010%), Cajun (91.7%, a difference of 0.010%), Lithuanian (91.7%, a difference of 0.030%), Immigrants from Lebanon (91.6%, a difference of 0.030%), and Palestinian (91.7%, a difference of 0.050%).
DemographicsRating | Rank1 or more Vehicles in Household
Canadians
99.8
/100
|
#66
Exceptional
91.8%
Spaniards
99.8
/100
|
#67
Exceptional
91.8%
Immigrants | Scotland
99.7
/100
|
#68
Exceptional
91.8%
Palestinians
99.7
/100
|
#69
Exceptional
91.7%
Lithuanians
99.7
/100
|
#70
Exceptional
91.7%
Poles
99.7
/100
|
#71
Exceptional
91.7%
Cajuns
99.7
/100
|
#72
Exceptional
91.7%
Immigrants | Iran
99.7
/100
|
#73
Exceptional
91.7%
Immigrants | Lebanon
99.6
/100
|
#74
Exceptional
91.6%
Portuguese
99.5
/100
|
#75
Exceptional
91.6%
Cubans
99.5
/100
|
#76
Exceptional
91.5%
Immigrants | Philippines
99.4
/100
|
#77
Exceptional
91.5%
Iranians
99.4
/100
|
#78
Exceptional
91.5%
Immigrants | South Central Asia
99.4
/100
|
#79
Exceptional
91.5%
Bolivians
99.4
/100
|
#80
Exceptional
91.5%