Apache vs Immigrants from Serbia 3 or more Vehicles in Household

COMPARE

Apache
Race
Ancestry
AfghanAfricanAlaska NativeAlaskan AthabascanAlbanianAleutAlsatianAmericanApacheArabArapahoArgentineanArmenianAssyrian/Chaldean/SyriacAustralianAustrianBahamianBangladeshiBarbadianBasqueBelgianBelizeanBermudanBhutaneseBlackfeetBolivianBrazilianBritishBritish West IndianBulgarianBurmeseCajunCambodianCanadianCape VerdeanCarpatho RusynCelticCentral AmericanCentral American IndianCherokeeCheyenneChickasawChileanChineseChippewaChoctawColombianColvilleComancheCosta RicanCreeCreekCroatianCrowCubanCypriotCzechCzechoslovakianDanishDelawareDominicanDutchDutch West IndianEastern EuropeanEcuadorianEgyptianEnglishEstonianEthiopianEuropeanFijianFilipinoFinnishFrenchFrench American IndianFrench CanadianGermanGerman RussianGhanaianGreekGuamanian/ChamorroGuatemalanGuyaneseHaitianHmongHonduranHopiHoumaHungarianIcelanderIndian (Asian)IndonesianInupiatIranianIraqiIrishIroquoisIsraeliItalianJamaicanJapaneseJordanianKenyanKiowaKoreanLaotianLatvianLebaneseLiberianLithuanianLumbeeLuxembourgerMacedonianMalaysianMalteseMarshalleseMenomineeMexicanMexican American IndianMongolianMoroccanNative HawaiianNavajoNepaleseNew ZealanderNicaraguanNigerianNorthern EuropeanNorwegianOkinawanOsageOttawaPaiutePakistaniPalestinianPanamanianParaguayanPennsylvania GermanPeruvianPimaPolishPortuguesePotawatomiPuebloPuerto RicanPuget Sound SalishRomanianRussianSalvadoranSamoanScandinavianScotch-IrishScottishSeminoleSenegaleseSerbianShoshoneSierra LeoneanSiouxSlavicSlovakSloveneSomaliSouth AfricanSouth AmericanSouth American IndianSoviet UnionSpaniardSpanishSpanish AmericanSpanish American IndianSri LankanSubsaharan AfricanSudaneseSwedishSwissSyrianTaiwaneseThaiTlingit-HaidaTohono O'OdhamTonganTrinidadian and TobagonianTsimshianTurkishU.S. Virgin IslanderUgandanUkrainianUruguayanUteVenezuelanVietnameseWelshWest IndianYakamaYaquiYugoslavianYumanYup'ikZimbabwean
Immigration
NonimmigrantsImmigrantsAfghanistanAfricaAlbaniaArgentinaArmeniaAsiaAustraliaAustriaBahamasBangladeshBarbadosBelarusBelgiumBelizeBoliviaBosnia and HerzegovinaBrazilBulgariaBurma/MyanmarCabo VerdeCambodiaCameroonCanadaCaribbeanCentral AmericaChileChinaColombiaCongoCosta RicaCroatiaCubaCzechoslovakiaDenmarkDominicaDominican RepublicEastern AfricaEastern AsiaEastern EuropeEcuadorEgyptEl SalvadorEnglandEritreaEthiopiaEuropeFijiFranceGermanyGhanaGreeceGrenadaGuatemalaGuyanaHaitiHondurasHong KongHungaryIndiaIndonesiaIranIraqIrelandIsraelItalyJamaicaJapanJordanKazakhstanKenyaKoreaKuwaitLaosLatin AmericaLatviaLebanonLiberiaLithuaniaMalaysiaMexicoMicronesiaMiddle AfricaMoldovaMoroccoNepalNetherlandsNicaraguaNigeriaNorth AmericaNorth MacedoniaNorthern AfricaNorthern EuropeNorwayOceaniaPakistanPanamaPeruPhilippinesPolandPortugalRomaniaRussiaSaudi ArabiaScotlandSenegalSierra LeoneSingaporeSomaliaSouth AfricaSouth AmericaSouth Central AsiaSouth Eastern AsiaSouthern EuropeSpainSri LankaSt. Vincent and the GrenadinesSudanSwedenSwitzerlandSyriaTaiwanThailandTrinidad and TobagoTurkeyUgandaUkraineUruguayUzbekistanVenezuelaVietnamWest IndiesWestern AfricaWestern AsiaWestern EuropeYemenZaireZimbabweAzores
Immigrants from Serbia
Race
Ancestry
AfghanAfricanAlaska NativeAlaskan AthabascanAlbanianAleutAlsatianAmericanArabArapahoArgentineanArmenianAssyrian/Chaldean/SyriacAustralianAustrianBahamianBangladeshiBarbadianBasqueBelgianBelizeanBermudanBhutaneseBlackfeetBolivianBrazilianBritishBritish West IndianBulgarianBurmeseCajunCambodianCanadianCape VerdeanCarpatho RusynCelticCentral AmericanCentral American IndianCherokeeCheyenneChickasawChileanChineseChippewaChoctawColombianColvilleComancheCosta RicanCreeCreekCroatianCrowCubanCypriotCzechCzechoslovakianDanishDelawareDominicanDutchDutch West IndianEastern EuropeanEcuadorianEgyptianEnglishEstonianEthiopianEuropeanFijianFilipinoFinnishFrenchFrench American IndianFrench CanadianGermanGerman RussianGhanaianGreekGuamanian/ChamorroGuatemalanGuyaneseHaitianHmongHonduranHopiHoumaHungarianIcelanderIndian (Asian)IndonesianInupiatIranianIraqiIrishIroquoisIsraeliItalianJamaicanJapaneseJordanianKenyanKiowaKoreanLaotianLatvianLebaneseLiberianLithuanianLumbeeLuxembourgerMacedonianMalaysianMalteseMarshalleseMenomineeMexicanMexican American IndianMongolianMoroccanNative HawaiianNavajoNepaleseNew ZealanderNicaraguanNigerianNorthern EuropeanNorwegianOkinawanOsageOttawaPaiutePakistaniPalestinianPanamanianParaguayanPennsylvania GermanPeruvianPimaPolishPortuguesePotawatomiPuebloPuerto RicanPuget Sound SalishRomanianRussianSalvadoranSamoanScandinavianScotch-IrishScottishSeminoleSenegaleseSerbianShoshoneSierra LeoneanSiouxSlavicSlovakSloveneSomaliSouth AfricanSouth AmericanSouth American IndianSoviet UnionSpaniardSpanishSpanish AmericanSpanish American IndianSri LankanSubsaharan AfricanSudaneseSwedishSwissSyrianTaiwaneseThaiTlingit-HaidaTohono O'OdhamTonganTrinidadian and TobagonianTsimshianTurkishU.S. Virgin IslanderUgandanUkrainianUruguayanUteVenezuelanVietnameseWelshWest IndianYakamaYaquiYugoslavianYumanYup'ikZimbabwean
Immigration
NonimmigrantsImmigrantsAfghanistanAfricaAlbaniaArgentinaArmeniaAsiaAustraliaAustriaBahamasBangladeshBarbadosBelarusBelgiumBelizeBoliviaBosnia and HerzegovinaBrazilBulgariaBurma/MyanmarCabo VerdeCambodiaCameroonCanadaCaribbeanCentral AmericaChileChinaColombiaCongoCosta RicaCroatiaCubaCzechoslovakiaDenmarkDominicaDominican RepublicEastern AfricaEastern AsiaEastern EuropeEcuadorEgyptEl SalvadorEnglandEritreaEthiopiaEuropeFijiFranceGermanyGhanaGreeceGrenadaGuatemalaGuyanaHaitiHondurasHong KongHungaryIndiaIndonesiaIranIraqIrelandIsraelItalyJamaicaJapanJordanKazakhstanKenyaKoreaKuwaitLaosLatin AmericaLatviaLebanonLiberiaLithuaniaMalaysiaMexicoMicronesiaMiddle AfricaMoldovaMoroccoNepalNetherlandsNicaraguaNigeriaNorth AmericaNorth MacedoniaNorthern AfricaNorthern EuropeNorwayOceaniaPakistanPanamaPeruPhilippinesPolandPortugalRomaniaRussiaSaudi ArabiaScotlandSenegalSerbiaSierra LeoneSingaporeSomaliaSouth AfricaSouth AmericaSouth Central AsiaSouth Eastern AsiaSouthern EuropeSpainSri LankaSt. Vincent and the GrenadinesSudanSwedenSwitzerlandSyriaTaiwanThailandTrinidad and TobagoTurkeyUgandaUkraineUruguayUzbekistanVenezuelaVietnamWest IndiesWestern AfricaWestern AsiaWestern EuropeYemenZaireZimbabweAzores
3 or more Vehicles in Household
Income
Poverty
Unemployment
Labor Participation
Family Structure
Vehicle Availability
Education Level
Disability

3 or more Vehicles in Household Comparison

Apache

Immigrants from Serbia

Exceptional
Tragic
21.2%
3 OR MORE VEHICLES IN HOUSEHOLD
98.9/ 100
METRIC RATING
92nd/ 347
METRIC RANK
16.4%
3 OR MORE VEHICLES IN HOUSEHOLD
0.0/ 100
METRIC RATING
303rd/ 347
METRIC RANK

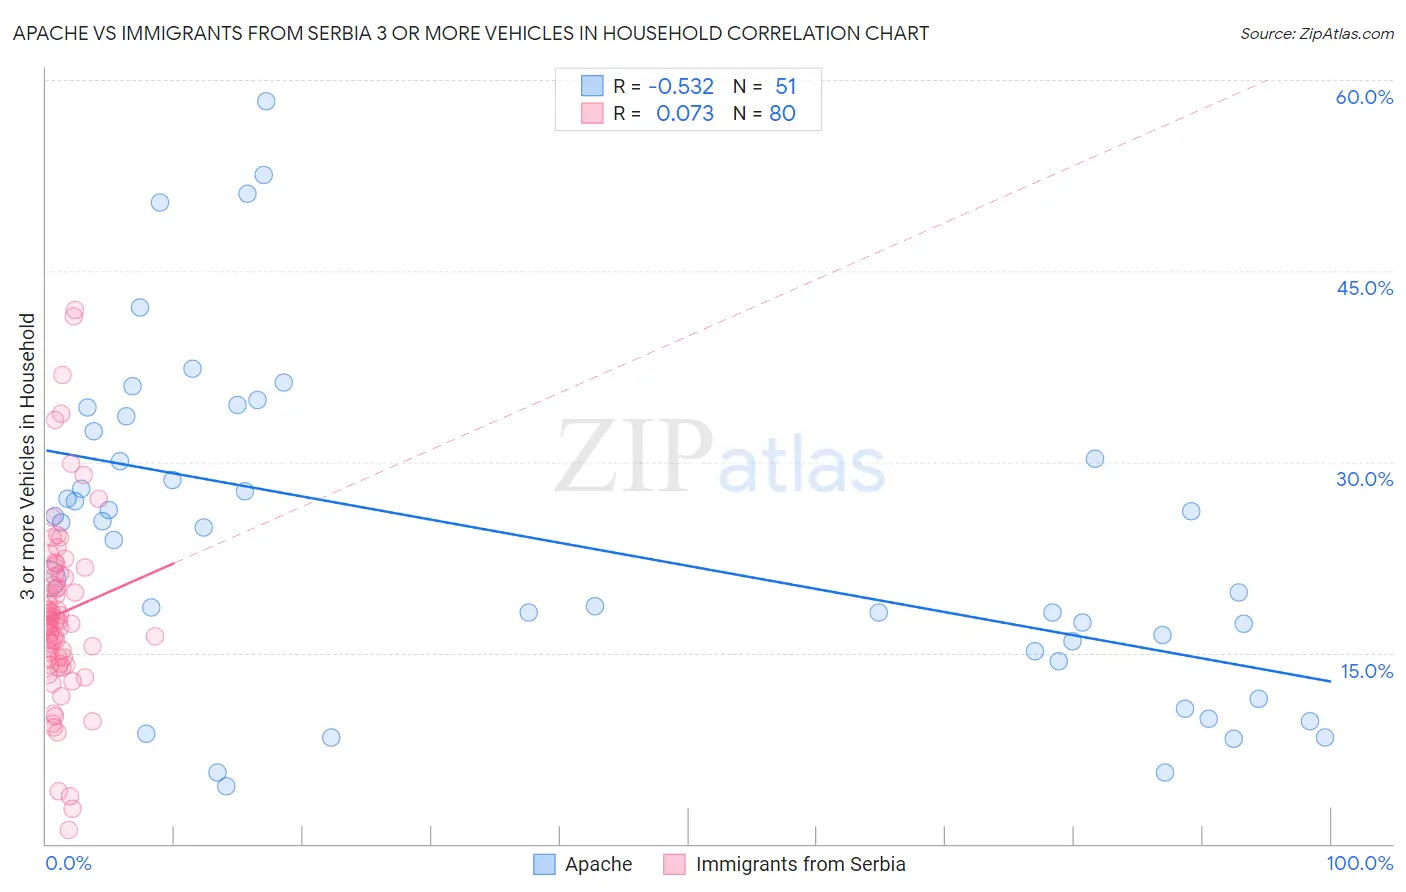
Apache vs Immigrants from Serbia 3 or more Vehicles in Household Correlation Chart

The statistical analysis conducted on geographies consisting of 231,026,513 people shows a substantial negative correlation between the proportion of Apache and percentage of households with 3 or more vehicles available in the United States with a correlation coefficient (R) of -0.532 and weighted average of 21.2%. Similarly, the statistical analysis conducted on geographies consisting of 131,699,405 people shows a slight positive correlation between the proportion of Immigrants from Serbia and percentage of households with 3 or more vehicles available in the United States with a correlation coefficient (R) of 0.073 and weighted average of 16.4%, a difference of 28.7%.
Apache vs Immigrants from Serbia 3 or more Vehicles in Household

3 or more Vehicles in Household Correlation Summary

MeasurementApacheImmigrants from Serbia
Minimum4.5%1.1%
Maximum58.3%41.9%
Range53.9%40.8%
Mean24.1%18.1%
Median24.8%17.4%
Interquartile 25% (IQ1)15.1%14.4%
Interquartile 75% (IQ3)32.4%21.1%
Interquartile Range (IQR)17.3%6.7%
Standard Deviation (Sample)12.8%7.4%
Standard Deviation (Population)12.7%7.4%

Similar Demographics by 3 or more Vehicles in Household

Demographics Similar to Apache by 3 or more Vehicles in Household

In terms of 3 or more vehicles in household, the demographic groups most similar to Apache are Belgian (21.2%, a difference of 0.080%), Immigrants from Indonesia (21.1%, a difference of 0.20%), Immigrants from Afghanistan (21.2%, a difference of 0.41%), Immigrants from Cambodia (21.1%, a difference of 0.43%), and Pakistani (21.0%, a difference of 0.57%).
DemographicsRating | Rank3 or more Vehicles in Household
Laotians
99.6
/100
|
#85
Exceptional
21.5%
Delaware
99.6
/100
|
#86
Exceptional
21.5%
Immigrants | Azores
99.5
/100
|
#87
Exceptional
21.5%
French
99.4
/100
|
#88
Exceptional
21.4%
Marshallese
99.2
/100
|
#89
Exceptional
21.3%
Immigrants | Afghanistan
99.1
/100
|
#90
Exceptional
21.2%
Belgians
98.9
/100
|
#91
Exceptional
21.2%
Apache
98.9
/100
|
#92
Exceptional
21.2%
Immigrants | Indonesia
98.8
/100
|
#93
Exceptional
21.1%
Immigrants | Cambodia
98.6
/100
|
#94
Exceptional
21.1%
Pakistanis
98.5
/100
|
#95
Exceptional
21.0%
Cree
98.4
/100
|
#96
Exceptional
21.0%
Canadians
98.3
/100
|
#97
Exceptional
21.0%
Hmong
98.2
/100
|
#98
Exceptional
21.0%
Alaska Natives
98.2
/100
|
#99
Exceptional
21.0%

Demographics Similar to Immigrants from Serbia by 3 or more Vehicles in Household

In terms of 3 or more vehicles in household, the demographic groups most similar to Immigrants from Serbia are Immigrants from Greece (16.5%, a difference of 0.31%), Ghanaian (16.4%, a difference of 0.47%), Paraguayan (16.6%, a difference of 0.73%), Immigrants from Morocco (16.3%, a difference of 0.74%), and Cypriot (16.6%, a difference of 1.1%).
DemographicsRating | Rank3 or more Vehicles in Household
Inupiat
0.1
/100
|
#296
Tragic
16.9%
Israelis
0.1
/100
|
#297
Tragic
16.8%
Immigrants | Zaire
0.1
/100
|
#298
Tragic
16.7%
Immigrants | South America
0.1
/100
|
#299
Tragic
16.7%
Cypriots
0.0
/100
|
#300
Tragic
16.6%
Paraguayans
0.0
/100
|
#301
Tragic
16.6%
Immigrants | Greece
0.0
/100
|
#302
Tragic
16.5%
Immigrants | Serbia
0.0
/100
|
#303
Tragic
16.4%
Ghanaians
0.0
/100
|
#304
Tragic
16.4%
Immigrants | Morocco
0.0
/100
|
#305
Tragic
16.3%
Somalis
0.0
/100
|
#306
Tragic
16.2%
Immigrants | Ghana
0.0
/100
|
#307
Tragic
16.2%
Houma
0.0
/100
|
#308
Tragic
16.1%
Immigrants | Somalia
0.0
/100
|
#309
Tragic
15.9%
Moroccans
0.0
/100
|
#310
Tragic
15.9%