Zip Codes with the Highest Percentage of Population with a Degree in Liberal Arts and History in Logan, UT
RELATED REPORTS & OPTIONS
Liberal Arts and History
Logan
Compare Zip Codes
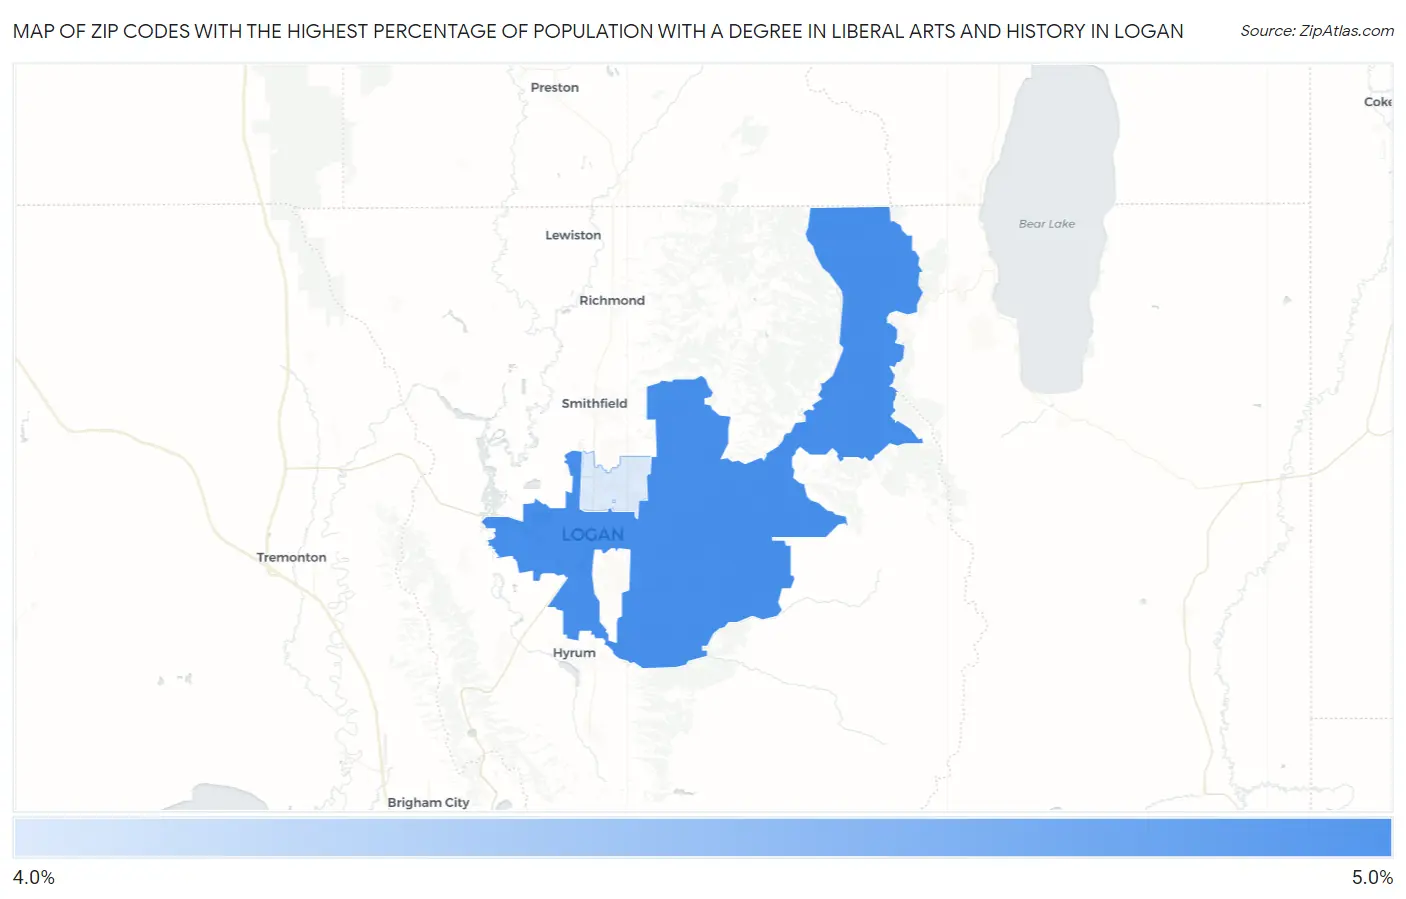
Map of Zip Codes with the Highest Percentage of Population with a Degree in Liberal Arts and History in Logan
0.0%
5.0%
Zip Codes with the Highest Percentage of Population with a Degree in Liberal Arts and History in Logan, UT
| Zip Code | % Graduates | vs State | vs National | |
| 1. | 84321 | 4.6% | 3.3%(+1.27)#56 | 4.9%(-0.287)#12,683 |
| 2. | 84341 | 4.1% | 3.3%(+0.766)#68 | 4.9%(-0.789)#14,456 |
1
Common Questions
What are the Top Zip Codes with the Highest Percentage of Population with a Degree in Liberal Arts and History in Logan, UT?
Top Zip Codes with the Highest Percentage of Population with a Degree in Liberal Arts and History in Logan, UT are:
What zip code has the Highest Percentage of Population with a Degree in Liberal Arts and History in Logan, UT?
84321 has the Highest Percentage of Population with a Degree in Liberal Arts and History in Logan, UT with 4.6%.
What is the Percentage of Population with a Degree in Liberal Arts and History in Logan, UT?
Percentage of Population with a Degree in Liberal Arts and History in Logan is 4.1%.
What is the Percentage of Population with a Degree in Liberal Arts and History in Utah?
Percentage of Population with a Degree in Liberal Arts and History in Utah is 3.3%.
What is the Percentage of Population with a Degree in Liberal Arts and History in the United States?
Percentage of Population with a Degree in Liberal Arts and History in the United States is 4.9%.