Yugoslavian vs Israeli Unemployment Among Women with Children Ages 6 to 17 years
COMPARE
Yugoslavian
Israeli
Unemployment Among Women with Children Ages 6 to 17 years
Unemployment Among Women with Children Ages 6 to 17 years Comparison
Yugoslavians
Israelis
8.5%
UNEMPLOYMENT AMONG WOMEN WITH CHILDREN AGES 6 TO 17 YEARS
99.0/ 100
METRIC RATING
90th/ 347
METRIC RANK
8.7%
UNEMPLOYMENT AMONG WOMEN WITH CHILDREN AGES 6 TO 17 YEARS
95.9/ 100
METRIC RATING
120th/ 347
METRIC RANK
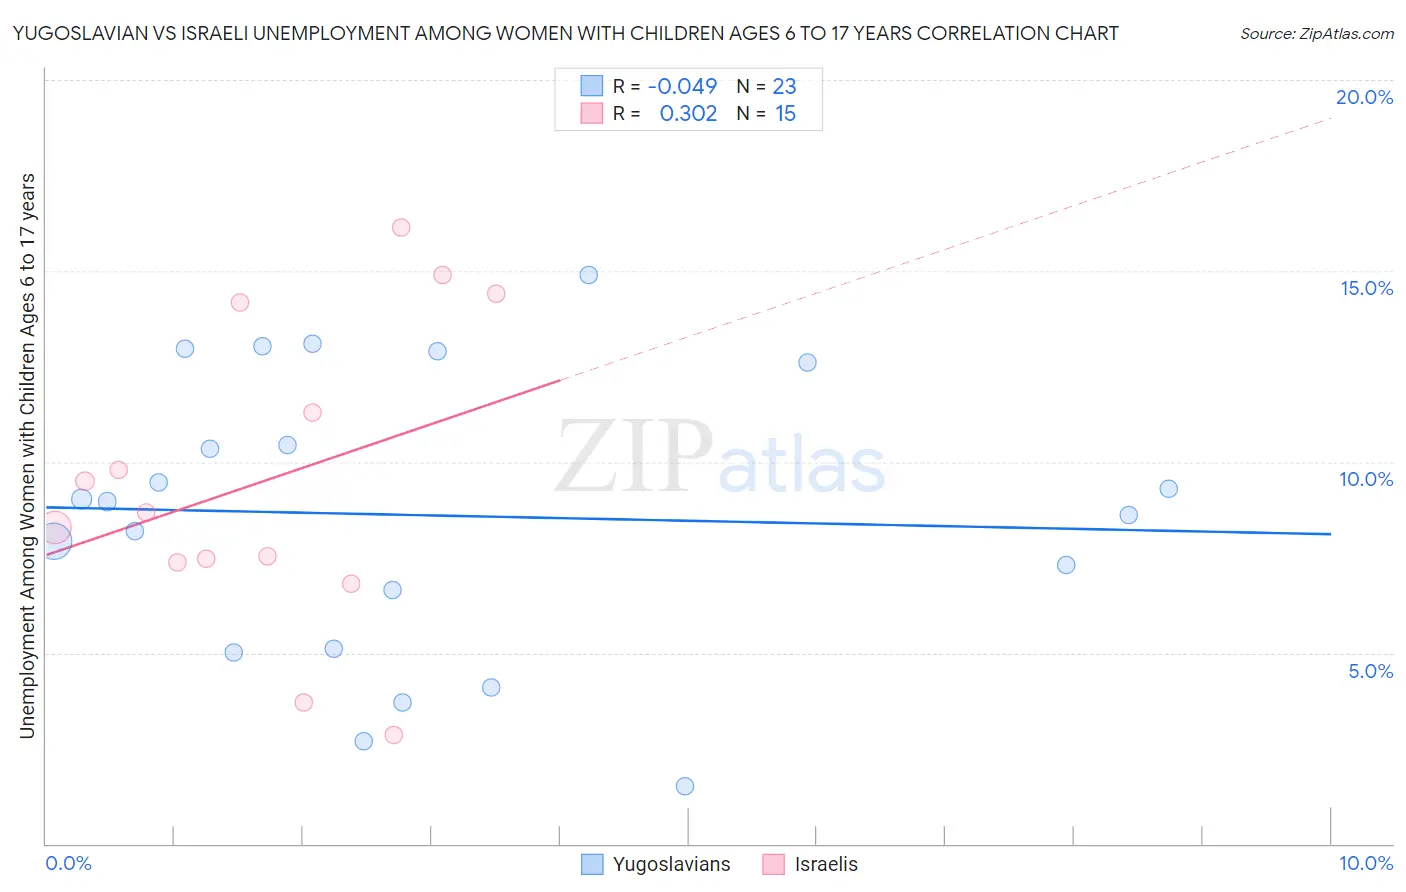
Yugoslavian vs Israeli Unemployment Among Women with Children Ages 6 to 17 years Correlation Chart
The statistical analysis conducted on geographies consisting of 213,370,013 people shows no correlation between the proportion of Yugoslavians and unemployment rate among women with children between the ages 6 and 17 in the United States with a correlation coefficient (R) of -0.049 and weighted average of 8.5%. Similarly, the statistical analysis conducted on geographies consisting of 167,871,710 people shows a mild positive correlation between the proportion of Israelis and unemployment rate among women with children between the ages 6 and 17 in the United States with a correlation coefficient (R) of 0.302 and weighted average of 8.7%, a difference of 1.8%.
Unemployment Among Women with Children Ages 6 to 17 years Correlation Summary
| Measurement | Yugoslavian | Israeli |
| Minimum | 1.5% | 2.8% |
| Maximum | 14.9% | 16.1% |
| Range | 13.4% | 13.3% |
| Mean | 8.6% | 9.5% |
| Median | 9.0% | 8.7% |
| Interquartile 25% (IQ1) | 5.1% | 7.4% |
| Interquartile 75% (IQ3) | 12.6% | 14.2% |
| Interquartile Range (IQR) | 7.5% | 6.8% |
| Standard Deviation (Sample) | 3.7% | 4.0% |
| Standard Deviation (Population) | 3.6% | 3.8% |
Similar Demographics by Unemployment Among Women with Children Ages 6 to 17 years
Demographics Similar to Yugoslavians by Unemployment Among Women with Children Ages 6 to 17 years
In terms of unemployment among women with children ages 6 to 17 years, the demographic groups most similar to Yugoslavians are Paiute (8.5%, a difference of 0.040%), Immigrants from Eastern Europe (8.5%, a difference of 0.060%), Potawatomi (8.5%, a difference of 0.090%), Immigrants from Vietnam (8.5%, a difference of 0.12%), and Immigrants from Israel (8.5%, a difference of 0.13%).
| Demographics | Rating | Rank | Unemployment Among Women with Children Ages 6 to 17 years |
| Bulgarians | 99.5 /100 | #83 | Exceptional 8.4% |
| Japanese | 99.5 /100 | #84 | Exceptional 8.4% |
| Immigrants | North Macedonia | 99.4 /100 | #85 | Exceptional 8.5% |
| Alaskan Athabascans | 99.4 /100 | #86 | Exceptional 8.5% |
| Immigrants | Israel | 99.1 /100 | #87 | Exceptional 8.5% |
| Immigrants | Vietnam | 99.1 /100 | #88 | Exceptional 8.5% |
| Paiute | 99.1 /100 | #89 | Exceptional 8.5% |
| Yugoslavians | 99.0 /100 | #90 | Exceptional 8.5% |
| Immigrants | Eastern Europe | 99.0 /100 | #91 | Exceptional 8.5% |
| Potawatomi | 99.0 /100 | #92 | Exceptional 8.5% |
| Australians | 98.9 /100 | #93 | Exceptional 8.5% |
| Immigrants | Barbados | 98.8 /100 | #94 | Exceptional 8.5% |
| Sri Lankans | 98.7 /100 | #95 | Exceptional 8.5% |
| German Russians | 98.6 /100 | #96 | Exceptional 8.5% |
| Bolivians | 98.5 /100 | #97 | Exceptional 8.5% |
Demographics Similar to Israelis by Unemployment Among Women with Children Ages 6 to 17 years
In terms of unemployment among women with children ages 6 to 17 years, the demographic groups most similar to Israelis are Immigrants from Grenada (8.6%, a difference of 0.080%), Pueblo (8.6%, a difference of 0.090%), Immigrants from Denmark (8.7%, a difference of 0.11%), Albanian (8.6%, a difference of 0.12%), and Zimbabwean (8.6%, a difference of 0.13%).
| Demographics | Rating | Rank | Unemployment Among Women with Children Ages 6 to 17 years |
| Eastern Europeans | 96.8 /100 | #113 | Exceptional 8.6% |
| Immigrants | Russia | 96.7 /100 | #114 | Exceptional 8.6% |
| Argentineans | 96.5 /100 | #115 | Exceptional 8.6% |
| Zimbabweans | 96.3 /100 | #116 | Exceptional 8.6% |
| Albanians | 96.3 /100 | #117 | Exceptional 8.6% |
| Pueblo | 96.2 /100 | #118 | Exceptional 8.6% |
| Immigrants | Grenada | 96.2 /100 | #119 | Exceptional 8.6% |
| Israelis | 95.9 /100 | #120 | Exceptional 8.7% |
| Immigrants | Denmark | 95.5 /100 | #121 | Exceptional 8.7% |
| Immigrants | Egypt | 95.0 /100 | #122 | Exceptional 8.7% |
| Immigrants | Morocco | 94.9 /100 | #123 | Exceptional 8.7% |
| Immigrants | Lebanon | 94.9 /100 | #124 | Exceptional 8.7% |
| South Africans | 94.6 /100 | #125 | Exceptional 8.7% |
| Immigrants | Northern Africa | 94.4 /100 | #126 | Exceptional 8.7% |
| Czechs | 94.4 /100 | #127 | Exceptional 8.7% |