Trinidadian and Tobagonian vs Luxembourger Unemployment Among Women with Children Under 6 years
COMPARE
Trinidadian and Tobagonian
Luxembourger
Unemployment Among Women with Children Under 6 years
Unemployment Among Women with Children Under 6 years Comparison
Trinidadians and Tobagonians
Luxembourgers
8.0%
UNEMPLOYMENT AMONG WOMEN WITH CHILDREN UNDER 6 YEARS
5.3/ 100
METRIC RATING
231st/ 347
METRIC RANK
6.6%
UNEMPLOYMENT AMONG WOMEN WITH CHILDREN UNDER 6 YEARS
100.0/ 100
METRIC RATING
36th/ 347
METRIC RANK
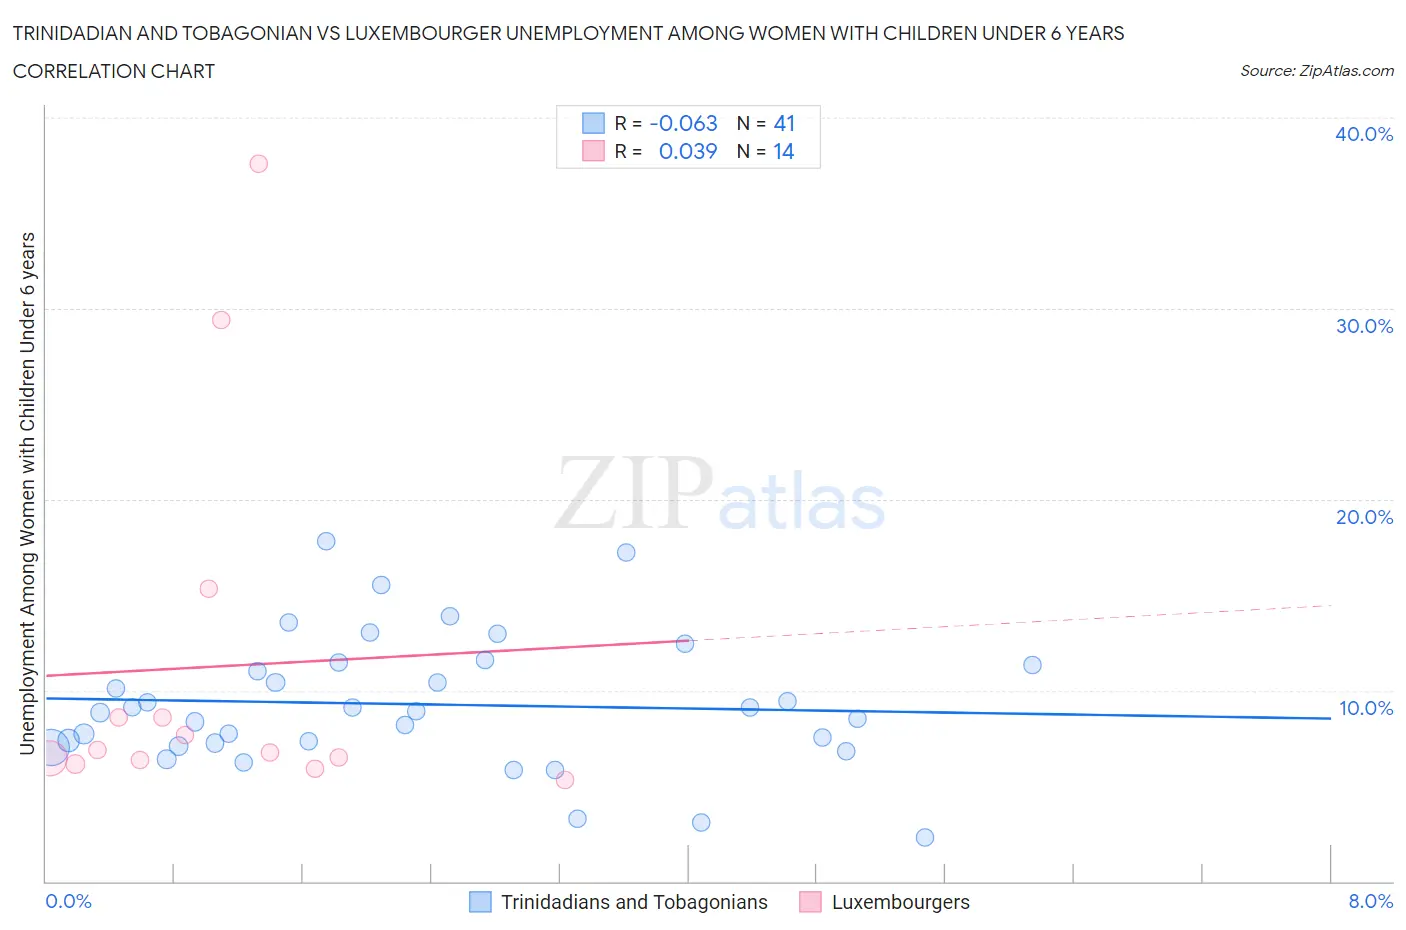
Trinidadian and Tobagonian vs Luxembourger Unemployment Among Women with Children Under 6 years Correlation Chart
The statistical analysis conducted on geographies consisting of 186,043,752 people shows a slight negative correlation between the proportion of Trinidadians and Tobagonians and unemployment rate among women with children under the age of 6 in the United States with a correlation coefficient (R) of -0.063 and weighted average of 8.0%. Similarly, the statistical analysis conducted on geographies consisting of 119,873,666 people shows no correlation between the proportion of Luxembourgers and unemployment rate among women with children under the age of 6 in the United States with a correlation coefficient (R) of 0.039 and weighted average of 6.6%, a difference of 20.8%.
Unemployment Among Women with Children Under 6 years Correlation Summary
| Measurement | Trinidadian and Tobagonian | Luxembourger |
| Minimum | 2.3% | 5.3% |
| Maximum | 17.8% | 37.6% |
| Range | 15.5% | 32.3% |
| Mean | 9.3% | 11.2% |
| Median | 8.9% | 6.8% |
| Interquartile 25% (IQ1) | 7.2% | 6.4% |
| Interquartile 75% (IQ3) | 11.4% | 8.6% |
| Interquartile Range (IQR) | 4.2% | 2.2% |
| Standard Deviation (Sample) | 3.4% | 9.9% |
| Standard Deviation (Population) | 3.4% | 9.5% |
Similar Demographics by Unemployment Among Women with Children Under 6 years
Demographics Similar to Trinidadians and Tobagonians by Unemployment Among Women with Children Under 6 years
In terms of unemployment among women with children under 6 years, the demographic groups most similar to Trinidadians and Tobagonians are Finnish (8.0%, a difference of 0.0%), Salvadoran (8.0%, a difference of 0.070%), Welsh (8.0%, a difference of 0.090%), Immigrants from Trinidad and Tobago (8.0%, a difference of 0.17%), and Immigrants from Sudan (8.0%, a difference of 0.22%).
| Demographics | Rating | Rank | Unemployment Among Women with Children Under 6 years |
| English | 7.2 /100 | #224 | Tragic 8.0% |
| Germans | 7.0 /100 | #225 | Tragic 8.0% |
| Senegalese | 6.2 /100 | #226 | Tragic 8.0% |
| Portuguese | 6.2 /100 | #227 | Tragic 8.0% |
| Immigrants | Sudan | 6.0 /100 | #228 | Tragic 8.0% |
| Salvadorans | 5.5 /100 | #229 | Tragic 8.0% |
| Finns | 5.3 /100 | #230 | Tragic 8.0% |
| Trinidadians and Tobagonians | 5.3 /100 | #231 | Tragic 8.0% |
| Welsh | 5.0 /100 | #232 | Tragic 8.0% |
| Immigrants | Trinidad and Tobago | 4.8 /100 | #233 | Tragic 8.0% |
| Kiowa | 4.4 /100 | #234 | Tragic 8.0% |
| Comanche | 4.3 /100 | #235 | Tragic 8.0% |
| Immigrants | Barbados | 4.2 /100 | #236 | Tragic 8.0% |
| Immigrants | Costa Rica | 4.1 /100 | #237 | Tragic 8.0% |
| Immigrants | Middle Africa | 3.2 /100 | #238 | Tragic 8.1% |
Demographics Similar to Luxembourgers by Unemployment Among Women with Children Under 6 years
In terms of unemployment among women with children under 6 years, the demographic groups most similar to Luxembourgers are Yakama (6.6%, a difference of 0.070%), Sri Lankan (6.6%, a difference of 0.25%), Immigrants from Vietnam (6.6%, a difference of 0.34%), Immigrants from South Central Asia (6.6%, a difference of 0.34%), and Tsimshian (6.6%, a difference of 0.36%).
| Demographics | Rating | Rank | Unemployment Among Women with Children Under 6 years |
| Immigrants | Sweden | 100.0 /100 | #29 | Exceptional 6.6% |
| Immigrants | Belarus | 100.0 /100 | #30 | Exceptional 6.6% |
| Immigrants | Moldova | 100.0 /100 | #31 | Exceptional 6.6% |
| Tsimshian | 100.0 /100 | #32 | Exceptional 6.6% |
| Immigrants | Vietnam | 100.0 /100 | #33 | Exceptional 6.6% |
| Immigrants | South Central Asia | 100.0 /100 | #34 | Exceptional 6.6% |
| Yakama | 100.0 /100 | #35 | Exceptional 6.6% |
| Luxembourgers | 100.0 /100 | #36 | Exceptional 6.6% |
| Sri Lankans | 100.0 /100 | #37 | Exceptional 6.6% |
| Hmong | 100.0 /100 | #38 | Exceptional 6.7% |
| Immigrants | Russia | 100.0 /100 | #39 | Exceptional 6.7% |
| Asians | 100.0 /100 | #40 | Exceptional 6.7% |
| Immigrants | Indonesia | 99.9 /100 | #41 | Exceptional 6.7% |
| Immigrants | Cuba | 99.9 /100 | #42 | Exceptional 6.7% |
| Bhutanese | 99.9 /100 | #43 | Exceptional 6.7% |