Arab vs Luxembourger Unemployment Among Women with Children Under 6 years

COMPARE

Arab
Race
Ancestry
AfghanAfricanAlaska NativeAlaskan AthabascanAlbanianAleutAlsatianAmericanApacheArabArapahoArgentineanArmenianAssyrian/Chaldean/SyriacAustralianAustrianBahamianBangladeshiBarbadianBasqueBelgianBelizeanBermudanBhutaneseBlackfeetBolivianBrazilianBritishBritish West IndianBulgarianBurmeseCajunCambodianCanadianCape VerdeanCarpatho RusynCelticCentral AmericanCentral American IndianCherokeeCheyenneChickasawChileanChineseChippewaChoctawColombianColvilleComancheCosta RicanCreeCreekCroatianCrowCubanCypriotCzechCzechoslovakianDanishDelawareDominicanDutchDutch West IndianEastern EuropeanEcuadorianEgyptianEnglishEstonianEthiopianEuropeanFijianFilipinoFinnishFrenchFrench American IndianFrench CanadianGermanGerman RussianGhanaianGreekGuamanian/ChamorroGuatemalanGuyaneseHaitianHmongHonduranHopiHoumaHungarianIcelanderIndian (Asian)IndonesianInupiatIranianIraqiIrishIroquoisIsraeliItalianJamaicanJapaneseJordanianKenyanKiowaKoreanLaotianLatvianLebaneseLiberianLithuanianLumbeeMacedonianMalaysianMalteseMarshalleseMenomineeMexicanMexican American IndianMongolianMoroccanNative HawaiianNavajoNepaleseNew ZealanderNicaraguanNigerianNorthern EuropeanNorwegianOkinawanOsageOttawaPaiutePakistaniPalestinianPanamanianParaguayanPennsylvania GermanPeruvianPimaPolishPortuguesePotawatomiPuebloPuerto RicanPuget Sound SalishRomanianRussianSalvadoranSamoanScandinavianScotch-IrishScottishSeminoleSenegaleseSerbianShoshoneSierra LeoneanSiouxSlavicSlovakSloveneSomaliSouth AfricanSouth AmericanSouth American IndianSoviet UnionSpaniardSpanishSpanish AmericanSpanish American IndianSri LankanSubsaharan AfricanSudaneseSwedishSwissSyrianTaiwaneseThaiTlingit-HaidaTohono O'OdhamTonganTrinidadian and TobagonianTsimshianTurkishU.S. Virgin IslanderUgandanUkrainianUruguayanUteVenezuelanVietnameseWelshWest IndianYakamaYaquiYugoslavianYumanYup'ikZimbabwean
Immigration
NonimmigrantsImmigrantsAfghanistanAfricaAlbaniaArgentinaArmeniaAsiaAustraliaAustriaBahamasBangladeshBarbadosBelarusBelgiumBelizeBoliviaBosnia and HerzegovinaBrazilBulgariaBurma/MyanmarCabo VerdeCambodiaCameroonCanadaCaribbeanCentral AmericaChileChinaColombiaCongoCosta RicaCroatiaCubaCzechoslovakiaDenmarkDominicaDominican RepublicEastern AfricaEastern AsiaEastern EuropeEcuadorEgyptEl SalvadorEnglandEritreaEthiopiaEuropeFijiFranceGermanyGhanaGreeceGrenadaGuatemalaGuyanaHaitiHondurasHong KongHungaryIndiaIndonesiaIranIraqIrelandIsraelItalyJamaicaJapanJordanKazakhstanKenyaKoreaKuwaitLaosLatin AmericaLatviaLebanonLiberiaLithuaniaMalaysiaMexicoMicronesiaMiddle AfricaMoldovaMoroccoNepalNetherlandsNicaraguaNigeriaNorth AmericaNorth MacedoniaNorthern AfricaNorthern EuropeNorwayOceaniaPakistanPanamaPeruPhilippinesPolandPortugalRomaniaRussiaSaudi ArabiaScotlandSenegalSerbiaSierra LeoneSingaporeSomaliaSouth AfricaSouth AmericaSouth Central AsiaSouth Eastern AsiaSouthern EuropeSpainSri LankaSt. Vincent and the GrenadinesSudanSwedenSwitzerlandSyriaTaiwanThailandTrinidad and TobagoTurkeyUgandaUkraineUruguayUzbekistanVenezuelaVietnamWest IndiesWestern AfricaWestern AsiaWestern EuropeYemenZaireZimbabweAzores
Luxembourger
Race
Ancestry
AfghanAfricanAlaska NativeAlaskan AthabascanAlbanianAleutAlsatianAmericanApacheArapahoArgentineanArmenianAssyrian/Chaldean/SyriacAustralianAustrianBahamianBangladeshiBarbadianBasqueBelgianBelizeanBermudanBhutaneseBlackfeetBolivianBrazilianBritishBritish West IndianBulgarianBurmeseCajunCambodianCanadianCape VerdeanCarpatho RusynCelticCentral AmericanCentral American IndianCherokeeCheyenneChickasawChileanChineseChippewaChoctawColombianColvilleComancheCosta RicanCreeCreekCroatianCrowCubanCypriotCzechCzechoslovakianDanishDelawareDominicanDutchDutch West IndianEastern EuropeanEcuadorianEgyptianEnglishEstonianEthiopianEuropeanFijianFilipinoFinnishFrenchFrench American IndianFrench CanadianGermanGerman RussianGhanaianGreekGuamanian/ChamorroGuatemalanGuyaneseHaitianHmongHonduranHopiHoumaHungarianIcelanderIndian (Asian)IndonesianInupiatIranianIraqiIrishIroquoisIsraeliItalianJamaicanJapaneseJordanianKenyanKiowaKoreanLaotianLatvianLebaneseLiberianLithuanianLumbeeLuxembourgerMacedonianMalaysianMalteseMarshalleseMenomineeMexicanMexican American IndianMongolianMoroccanNative HawaiianNavajoNepaleseNew ZealanderNicaraguanNigerianNorthern EuropeanNorwegianOkinawanOsageOttawaPaiutePakistaniPalestinianPanamanianParaguayanPennsylvania GermanPeruvianPimaPolishPortuguesePotawatomiPuebloPuerto RicanPuget Sound SalishRomanianRussianSalvadoranSamoanScandinavianScotch-IrishScottishSeminoleSenegaleseSerbianShoshoneSierra LeoneanSiouxSlavicSlovakSloveneSomaliSouth AfricanSouth AmericanSouth American IndianSoviet UnionSpaniardSpanishSpanish AmericanSpanish American IndianSri LankanSubsaharan AfricanSudaneseSwedishSwissSyrianTaiwaneseThaiTlingit-HaidaTohono O'OdhamTonganTrinidadian and TobagonianTsimshianTurkishU.S. Virgin IslanderUgandanUkrainianUruguayanUteVenezuelanVietnameseWelshWest IndianYakamaYaquiYugoslavianYumanYup'ikZimbabwean
Immigration
NonimmigrantsImmigrantsAfghanistanAfricaAlbaniaArgentinaArmeniaAsiaAustraliaAustriaBahamasBangladeshBarbadosBelarusBelgiumBelizeBoliviaBosnia and HerzegovinaBrazilBulgariaBurma/MyanmarCabo VerdeCambodiaCameroonCanadaCaribbeanCentral AmericaChileChinaColombiaCongoCosta RicaCroatiaCubaCzechoslovakiaDenmarkDominicaDominican RepublicEastern AfricaEastern AsiaEastern EuropeEcuadorEgyptEl SalvadorEnglandEritreaEthiopiaEuropeFijiFranceGermanyGhanaGreeceGrenadaGuatemalaGuyanaHaitiHondurasHong KongHungaryIndiaIndonesiaIranIraqIrelandIsraelItalyJamaicaJapanJordanKazakhstanKenyaKoreaKuwaitLaosLatin AmericaLatviaLebanonLiberiaLithuaniaMalaysiaMexicoMicronesiaMiddle AfricaMoldovaMoroccoNepalNetherlandsNicaraguaNigeriaNorth AmericaNorth MacedoniaNorthern AfricaNorthern EuropeNorwayOceaniaPakistanPanamaPeruPhilippinesPolandPortugalRomaniaRussiaSaudi ArabiaScotlandSenegalSerbiaSierra LeoneSingaporeSomaliaSouth AfricaSouth AmericaSouth Central AsiaSouth Eastern AsiaSouthern EuropeSpainSri LankaSt. Vincent and the GrenadinesSudanSwedenSwitzerlandSyriaTaiwanThailandTrinidad and TobagoTurkeyUgandaUkraineUruguayUzbekistanVenezuelaVietnamWest IndiesWestern AfricaWestern AsiaWestern EuropeYemenZaireZimbabweAzores
Unemployment Among Women with Children Under 6 years
Income
Poverty
Unemployment
Labor Participation
Family Structure
Vehicle Availability
Education Level
Disability

Unemployment Among Women with Children Under 6 years Comparison

Arabs

Luxembourgers

Tragic
Exceptional
7.9%
UNEMPLOYMENT AMONG WOMEN WITH CHILDREN UNDER 6 YEARS
9.4/ 100
METRIC RATING
219th/ 347
METRIC RANK
6.6%
UNEMPLOYMENT AMONG WOMEN WITH CHILDREN UNDER 6 YEARS
100.0/ 100
METRIC RATING
36th/ 347
METRIC RANK

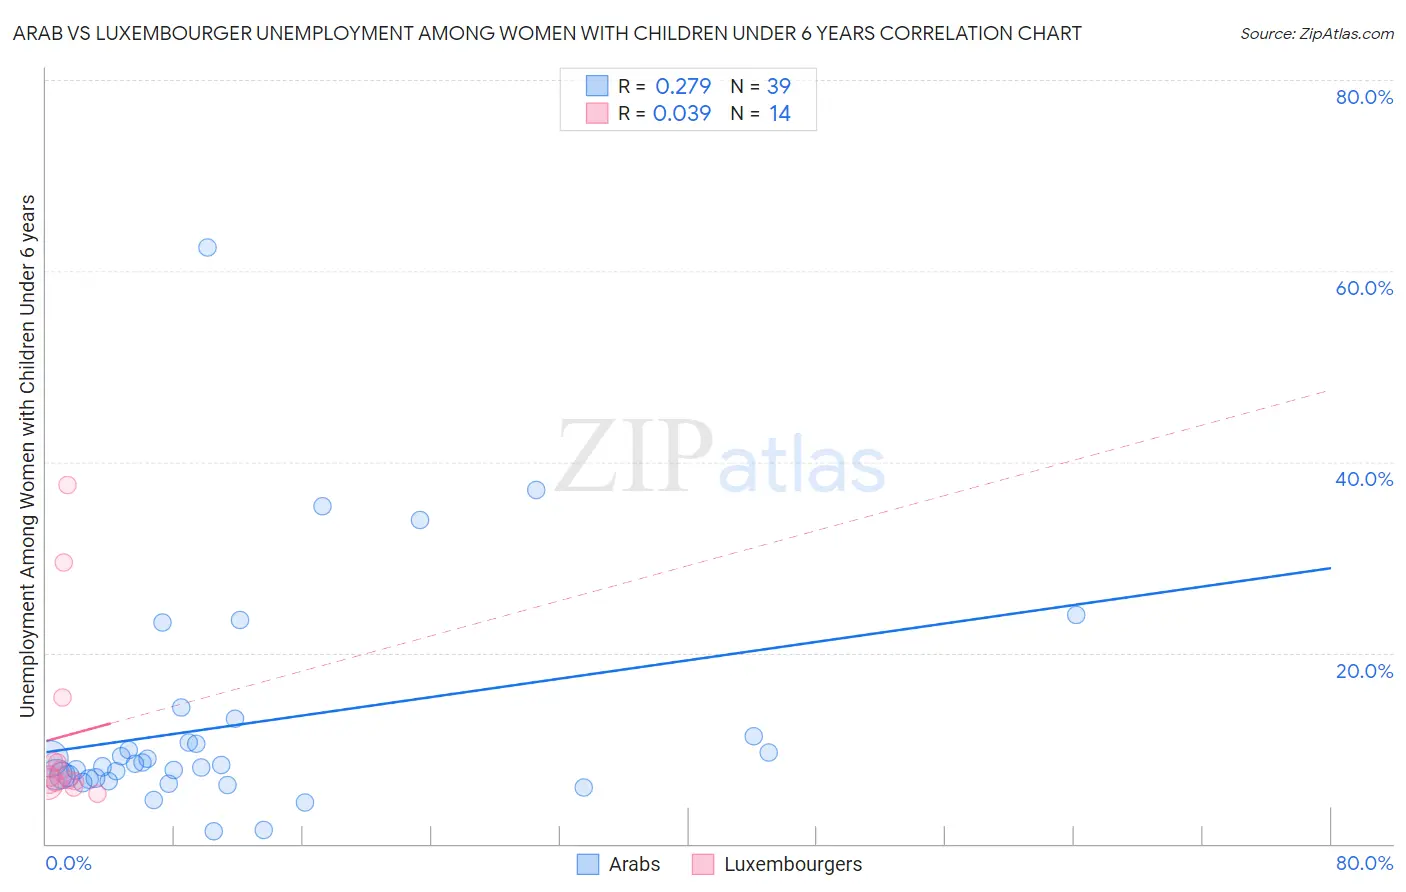
Arab vs Luxembourger Unemployment Among Women with Children Under 6 years Correlation Chart

The statistical analysis conducted on geographies consisting of 351,431,027 people shows a weak positive correlation between the proportion of Arabs and unemployment rate among women with children under the age of 6 in the United States with a correlation coefficient (R) of 0.279 and weighted average of 7.9%. Similarly, the statistical analysis conducted on geographies consisting of 119,873,666 people shows no correlation between the proportion of Luxembourgers and unemployment rate among women with children under the age of 6 in the United States with a correlation coefficient (R) of 0.039 and weighted average of 6.6%, a difference of 19.7%.
Arab vs Luxembourger Unemployment Among Women with Children Under 6 years

Unemployment Among Women with Children Under 6 years Correlation Summary

MeasurementArabLuxembourger
Minimum1.3%5.3%
Maximum62.5%37.6%
Range61.2%32.3%
Mean12.5%11.2%
Median8.3%6.8%
Interquartile 25% (IQ1)6.8%6.4%
Interquartile 75% (IQ3)11.3%8.6%
Interquartile Range (IQR)4.5%2.2%
Standard Deviation (Sample)11.9%9.9%
Standard Deviation (Population)11.8%9.5%

Similar Demographics by Unemployment Among Women with Children Under 6 years

Demographics Similar to Arabs by Unemployment Among Women with Children Under 6 years

In terms of unemployment among women with children under 6 years, the demographic groups most similar to Arabs are South American Indian (7.9%, a difference of 0.020%), Moroccan (7.9%, a difference of 0.070%), Immigrants from Germany (7.9%, a difference of 0.17%), Immigrants from Nigeria (7.9%, a difference of 0.18%), and Samoan (7.9%, a difference of 0.19%).
DemographicsRating | RankUnemployment Among Women with Children Under 6 years
Swiss
12.3
/100
|
#212
Poor
7.9%
Scottish
11.4
/100
|
#213
Poor
7.9%
Spanish
11.3
/100
|
#214
Poor
7.9%
Ecuadorians
11.2
/100
|
#215
Poor
7.9%
Immigrants | Lebanon
11.1
/100
|
#216
Poor
7.9%
Immigrants | Nigeria
10.3
/100
|
#217
Poor
7.9%
Moroccans
9.7
/100
|
#218
Tragic
7.9%
Arabs
9.4
/100
|
#219
Tragic
7.9%
South American Indians
9.3
/100
|
#220
Tragic
7.9%
Immigrants | Germany
8.5
/100
|
#221
Tragic
7.9%
Samoans
8.4
/100
|
#222
Tragic
7.9%
Carpatho Rusyns
7.8
/100
|
#223
Tragic
8.0%
English
7.2
/100
|
#224
Tragic
8.0%
Germans
7.0
/100
|
#225
Tragic
8.0%
Senegalese
6.2
/100
|
#226
Tragic
8.0%

Demographics Similar to Luxembourgers by Unemployment Among Women with Children Under 6 years

In terms of unemployment among women with children under 6 years, the demographic groups most similar to Luxembourgers are Yakama (6.6%, a difference of 0.070%), Sri Lankan (6.6%, a difference of 0.25%), Immigrants from Vietnam (6.6%, a difference of 0.34%), Immigrants from South Central Asia (6.6%, a difference of 0.34%), and Tsimshian (6.6%, a difference of 0.36%).
DemographicsRating | RankUnemployment Among Women with Children Under 6 years
Immigrants | Sweden
100.0
/100
|
#29
Exceptional
6.6%
Immigrants | Belarus
100.0
/100
|
#30
Exceptional
6.6%
Immigrants | Moldova
100.0
/100
|
#31
Exceptional
6.6%
Tsimshian
100.0
/100
|
#32
Exceptional
6.6%
Immigrants | Vietnam
100.0
/100
|
#33
Exceptional
6.6%
Immigrants | South Central Asia
100.0
/100
|
#34
Exceptional
6.6%
Yakama
100.0
/100
|
#35
Exceptional
6.6%
Luxembourgers
100.0
/100
|
#36
Exceptional
6.6%
Sri Lankans
100.0
/100
|
#37
Exceptional
6.6%
Hmong
100.0
/100
|
#38
Exceptional
6.7%
Immigrants | Russia
100.0
/100
|
#39
Exceptional
6.7%
Asians
100.0
/100
|
#40
Exceptional
6.7%
Immigrants | Indonesia
99.9
/100
|
#41
Exceptional
6.7%
Immigrants | Cuba
99.9
/100
|
#42
Exceptional
6.7%
Bhutanese
99.9
/100
|
#43
Exceptional
6.7%