Trinidadian and Tobagonian vs Czechoslovakian Unemployment Among Women with Children Under 6 years
COMPARE
Trinidadian and Tobagonian
Czechoslovakian
Unemployment Among Women with Children Under 6 years
Unemployment Among Women with Children Under 6 years Comparison
Trinidadians and Tobagonians
Czechoslovakians
8.0%
UNEMPLOYMENT AMONG WOMEN WITH CHILDREN UNDER 6 YEARS
5.3/ 100
METRIC RATING
231st/ 347
METRIC RANK
7.7%
UNEMPLOYMENT AMONG WOMEN WITH CHILDREN UNDER 6 YEARS
38.4/ 100
METRIC RATING
188th/ 347
METRIC RANK
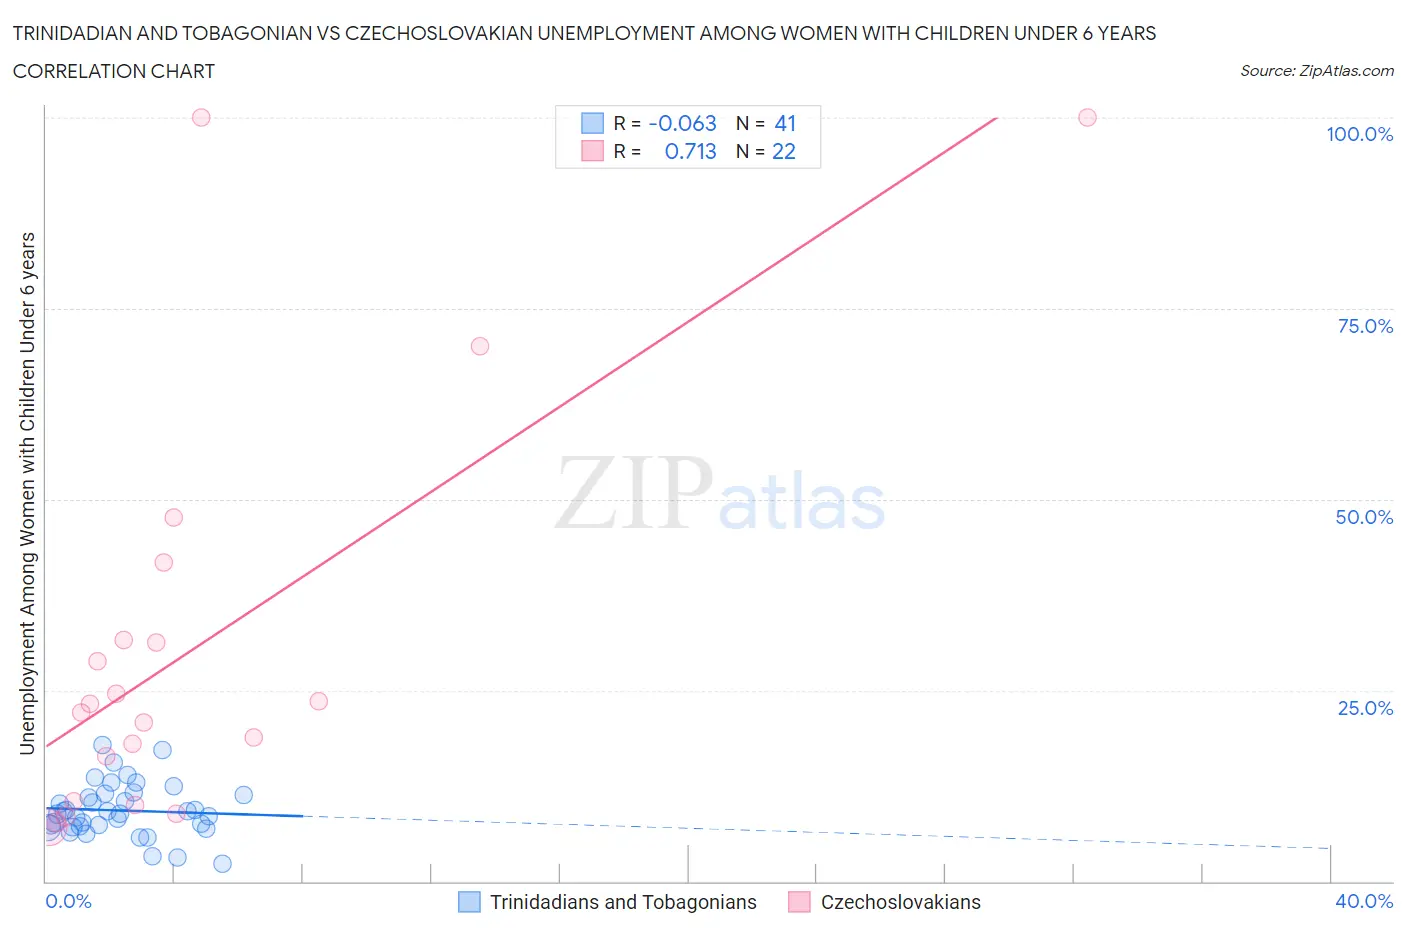
Trinidadian and Tobagonian vs Czechoslovakian Unemployment Among Women with Children Under 6 years Correlation Chart
The statistical analysis conducted on geographies consisting of 186,043,752 people shows a slight negative correlation between the proportion of Trinidadians and Tobagonians and unemployment rate among women with children under the age of 6 in the United States with a correlation coefficient (R) of -0.063 and weighted average of 8.0%. Similarly, the statistical analysis conducted on geographies consisting of 272,908,849 people shows a strong positive correlation between the proportion of Czechoslovakians and unemployment rate among women with children under the age of 6 in the United States with a correlation coefficient (R) of 0.713 and weighted average of 7.7%, a difference of 4.0%.
Unemployment Among Women with Children Under 6 years Correlation Summary
| Measurement | Trinidadian and Tobagonian | Czechoslovakian |
| Minimum | 2.3% | 7.1% |
| Maximum | 17.8% | 100.0% |
| Range | 15.5% | 92.9% |
| Mean | 9.3% | 30.5% |
| Median | 8.9% | 22.7% |
| Interquartile 25% (IQ1) | 7.2% | 10.5% |
| Interquartile 75% (IQ3) | 11.4% | 31.6% |
| Interquartile Range (IQR) | 4.2% | 21.1% |
| Standard Deviation (Sample) | 3.4% | 27.0% |
| Standard Deviation (Population) | 3.4% | 26.4% |
Similar Demographics by Unemployment Among Women with Children Under 6 years
Demographics Similar to Trinidadians and Tobagonians by Unemployment Among Women with Children Under 6 years
In terms of unemployment among women with children under 6 years, the demographic groups most similar to Trinidadians and Tobagonians are Finnish (8.0%, a difference of 0.0%), Salvadoran (8.0%, a difference of 0.070%), Welsh (8.0%, a difference of 0.090%), Immigrants from Trinidad and Tobago (8.0%, a difference of 0.17%), and Immigrants from Sudan (8.0%, a difference of 0.22%).
| Demographics | Rating | Rank | Unemployment Among Women with Children Under 6 years |
| English | 7.2 /100 | #224 | Tragic 8.0% |
| Germans | 7.0 /100 | #225 | Tragic 8.0% |
| Senegalese | 6.2 /100 | #226 | Tragic 8.0% |
| Portuguese | 6.2 /100 | #227 | Tragic 8.0% |
| Immigrants | Sudan | 6.0 /100 | #228 | Tragic 8.0% |
| Salvadorans | 5.5 /100 | #229 | Tragic 8.0% |
| Finns | 5.3 /100 | #230 | Tragic 8.0% |
| Trinidadians and Tobagonians | 5.3 /100 | #231 | Tragic 8.0% |
| Welsh | 5.0 /100 | #232 | Tragic 8.0% |
| Immigrants | Trinidad and Tobago | 4.8 /100 | #233 | Tragic 8.0% |
| Kiowa | 4.4 /100 | #234 | Tragic 8.0% |
| Comanche | 4.3 /100 | #235 | Tragic 8.0% |
| Immigrants | Barbados | 4.2 /100 | #236 | Tragic 8.0% |
| Immigrants | Costa Rica | 4.1 /100 | #237 | Tragic 8.0% |
| Immigrants | Middle Africa | 3.2 /100 | #238 | Tragic 8.1% |
Demographics Similar to Czechoslovakians by Unemployment Among Women with Children Under 6 years
In terms of unemployment among women with children under 6 years, the demographic groups most similar to Czechoslovakians are Immigrants from Thailand (7.7%, a difference of 0.010%), Yugoslavian (7.7%, a difference of 0.060%), Spanish American (7.7%, a difference of 0.080%), Indonesian (7.7%, a difference of 0.14%), and Immigrants from Panama (7.7%, a difference of 0.20%).
| Demographics | Rating | Rank | Unemployment Among Women with Children Under 6 years |
| Brazilians | 43.9 /100 | #181 | Average 7.7% |
| Nepalese | 43.5 /100 | #182 | Average 7.7% |
| Sierra Leoneans | 42.9 /100 | #183 | Average 7.7% |
| Indonesians | 40.5 /100 | #184 | Average 7.7% |
| Spanish Americans | 39.7 /100 | #185 | Fair 7.7% |
| Yugoslavians | 39.4 /100 | #186 | Fair 7.7% |
| Immigrants | Thailand | 38.5 /100 | #187 | Fair 7.7% |
| Czechoslovakians | 38.4 /100 | #188 | Fair 7.7% |
| Immigrants | Panama | 35.7 /100 | #189 | Fair 7.7% |
| Immigrants | North Macedonia | 34.4 /100 | #190 | Fair 7.7% |
| Immigrants | Austria | 32.4 /100 | #191 | Fair 7.7% |
| Immigrants | Africa | 32.4 /100 | #192 | Fair 7.7% |
| Slavs | 32.4 /100 | #193 | Fair 7.7% |
| Syrians | 31.9 /100 | #194 | Fair 7.7% |
| Malaysians | 31.1 /100 | #195 | Fair 7.7% |