Immigrants from Switzerland vs Nepalese Unemployment Among Women with Children Ages 6 to 17 years

COMPARE

Immigrants from Switzerland
Race
Ancestry
AfghanAfricanAlaska NativeAlaskan AthabascanAlbanianAleutAlsatianAmericanApacheArabArapahoArgentineanArmenianAssyrian/Chaldean/SyriacAustralianAustrianBahamianBangladeshiBarbadianBasqueBelgianBelizeanBermudanBhutaneseBlackfeetBolivianBrazilianBritishBritish West IndianBulgarianBurmeseCajunCambodianCanadianCape VerdeanCarpatho RusynCelticCentral AmericanCentral American IndianCherokeeCheyenneChickasawChileanChineseChippewaChoctawColombianColvilleComancheCosta RicanCreeCreekCroatianCrowCubanCypriotCzechCzechoslovakianDanishDelawareDominicanDutchDutch West IndianEastern EuropeanEcuadorianEgyptianEnglishEstonianEthiopianEuropeanFijianFilipinoFinnishFrenchFrench American IndianFrench CanadianGermanGerman RussianGhanaianGreekGuamanian/ChamorroGuatemalanGuyaneseHaitianHmongHonduranHopiHoumaHungarianIcelanderIndian (Asian)IndonesianInupiatIranianIraqiIrishIroquoisIsraeliItalianJamaicanJapaneseJordanianKenyanKiowaKoreanLaotianLatvianLebaneseLiberianLithuanianLumbeeLuxembourgerMacedonianMalaysianMalteseMarshalleseMenomineeMexicanMexican American IndianMongolianMoroccanNative HawaiianNavajoNew ZealanderNicaraguanNigerianNorthern EuropeanNorwegianOkinawanOsageOttawaPaiutePakistaniPalestinianPanamanianParaguayanPennsylvania GermanPeruvianPimaPolishPortuguesePotawatomiPuebloPuerto RicanPuget Sound SalishRomanianRussianSalvadoranSamoanScandinavianScotch-IrishScottishSeminoleSenegaleseSerbianShoshoneSierra LeoneanSiouxSlavicSlovakSloveneSomaliSouth AfricanSouth AmericanSouth American IndianSoviet UnionSpaniardSpanishSpanish AmericanSpanish American IndianSri LankanSubsaharan AfricanSudaneseSwedishSwissSyrianTaiwaneseThaiTlingit-HaidaTohono O'OdhamTonganTrinidadian and TobagonianTsimshianTurkishU.S. Virgin IslanderUgandanUkrainianUruguayanUteVenezuelanVietnameseWelshWest IndianYakamaYaquiYugoslavianYumanYup'ikZimbabwean
Immigration
NonimmigrantsImmigrantsAfghanistanAfricaAlbaniaArgentinaArmeniaAsiaAustraliaAustriaBahamasBangladeshBarbadosBelarusBelgiumBelizeBoliviaBosnia and HerzegovinaBrazilBulgariaBurma/MyanmarCabo VerdeCambodiaCameroonCanadaCaribbeanCentral AmericaChileChinaColombiaCongoCosta RicaCroatiaCubaCzechoslovakiaDenmarkDominicaDominican RepublicEastern AfricaEastern AsiaEastern EuropeEcuadorEgyptEl SalvadorEnglandEritreaEthiopiaEuropeFijiFranceGermanyGhanaGreeceGrenadaGuatemalaGuyanaHaitiHondurasHong KongHungaryIndiaIndonesiaIranIraqIrelandIsraelItalyJamaicaJapanJordanKazakhstanKenyaKoreaKuwaitLaosLatin AmericaLatviaLebanonLiberiaLithuaniaMalaysiaMexicoMicronesiaMiddle AfricaMoldovaMoroccoNepalNetherlandsNicaraguaNigeriaNorth AmericaNorth MacedoniaNorthern AfricaNorthern EuropeNorwayOceaniaPakistanPanamaPeruPhilippinesPolandPortugalRomaniaRussiaSaudi ArabiaScotlandSenegalSerbiaSierra LeoneSingaporeSomaliaSouth AfricaSouth AmericaSouth Central AsiaSouth Eastern AsiaSouthern EuropeSpainSri LankaSt. Vincent and the GrenadinesSudanSwedenSwitzerlandSyriaTaiwanThailandTrinidad and TobagoTurkeyUgandaUkraineUruguayUzbekistanVenezuelaVietnamWest IndiesWestern AfricaWestern AsiaWestern EuropeYemenZaireZimbabweAzores
Nepalese
Race
Ancestry
AfghanAfricanAlaska NativeAlaskan AthabascanAlbanianAleutAlsatianAmericanApacheArabArapahoArgentineanArmenianAssyrian/Chaldean/SyriacAustralianAustrianBahamianBangladeshiBarbadianBasqueBelgianBelizeanBermudanBhutaneseBlackfeetBolivianBrazilianBritishBritish West IndianBulgarianBurmeseCajunCambodianCanadianCape VerdeanCarpatho RusynCelticCentral AmericanCentral American IndianCherokeeCheyenneChickasawChileanChineseChippewaChoctawColombianColvilleComancheCosta RicanCreeCreekCroatianCrowCubanCypriotCzechCzechoslovakianDanishDelawareDominicanDutchDutch West IndianEastern EuropeanEcuadorianEgyptianEnglishEstonianEthiopianEuropeanFijianFilipinoFinnishFrenchFrench American IndianFrench CanadianGermanGerman RussianGhanaianGreekGuamanian/ChamorroGuatemalanGuyaneseHaitianHmongHonduranHopiHoumaHungarianIcelanderIndian (Asian)IndonesianInupiatIranianIraqiIrishIroquoisIsraeliItalianJamaicanJapaneseJordanianKenyanKiowaKoreanLaotianLatvianLebaneseLiberianLithuanianLumbeeLuxembourgerMacedonianMalaysianMalteseMarshalleseMenomineeMexicanMexican American IndianMongolianMoroccanNative HawaiianNavajoNepaleseNew ZealanderNicaraguanNigerianNorthern EuropeanNorwegianOkinawanOsageOttawaPaiutePakistaniPalestinianPanamanianParaguayanPennsylvania GermanPeruvianPimaPolishPortuguesePotawatomiPuebloPuerto RicanPuget Sound SalishRomanianRussianSalvadoranSamoanScandinavianScotch-IrishScottishSeminoleSenegaleseSerbianShoshoneSierra LeoneanSiouxSlavicSlovakSloveneSomaliSouth AfricanSouth AmericanSouth American IndianSoviet UnionSpaniardSpanishSpanish AmericanSpanish American IndianSri LankanSubsaharan AfricanSudaneseSwedishSwissSyrianTaiwaneseThaiTlingit-HaidaTohono O'OdhamTonganTrinidadian and TobagonianTsimshianTurkishU.S. Virgin IslanderUgandanUkrainianUruguayanUteVenezuelanVietnameseWelshWest IndianYakamaYaquiYugoslavianYumanYup'ikZimbabwean
Immigration
NonimmigrantsImmigrantsAfghanistanAfricaAlbaniaArgentinaArmeniaAsiaAustraliaAustriaBahamasBangladeshBarbadosBelarusBelgiumBelizeBoliviaBosnia and HerzegovinaBrazilBulgariaBurma/MyanmarCabo VerdeCambodiaCameroonCanadaCaribbeanCentral AmericaChileChinaColombiaCongoCosta RicaCroatiaCubaCzechoslovakiaDenmarkDominicaDominican RepublicEastern AfricaEastern AsiaEastern EuropeEcuadorEgyptEl SalvadorEnglandEritreaEthiopiaEuropeFijiFranceGermanyGhanaGreeceGrenadaGuatemalaGuyanaHaitiHondurasHong KongHungaryIndiaIndonesiaIranIraqIrelandIsraelItalyJamaicaJapanJordanKazakhstanKenyaKoreaKuwaitLaosLatin AmericaLatviaLebanonLiberiaLithuaniaMalaysiaMexicoMicronesiaMiddle AfricaMoldovaMoroccoNepalNetherlandsNicaraguaNigeriaNorth AmericaNorth MacedoniaNorthern AfricaNorthern EuropeNorwayOceaniaPakistanPanamaPeruPhilippinesPolandPortugalRomaniaRussiaSaudi ArabiaScotlandSenegalSerbiaSierra LeoneSingaporeSomaliaSouth AfricaSouth AmericaSouth Central AsiaSouth Eastern AsiaSouthern EuropeSpainSri LankaSt. Vincent and the GrenadinesSudanSwedenSyriaTaiwanThailandTrinidad and TobagoTurkeyUgandaUkraineUruguayUzbekistanVenezuelaVietnamWest IndiesWestern AfricaWestern AsiaWestern EuropeYemenZaireZimbabweAzores
Unemployment Among Women with Children Ages 6 to 17 years
Income
Poverty
Unemployment
Labor Participation
Family Structure
Vehicle Availability
Education Level
Disability

Unemployment Among Women with Children Ages 6 to 17 years Comparison

Immigrants from Switzerland

Nepalese

Exceptional
Exceptional
8.1%
UNEMPLOYMENT AMONG WOMEN WITH CHILDREN AGES 6 TO 17 YEARS
100.0/ 100
METRIC RATING
47th/ 347
METRIC RANK
7.7%
UNEMPLOYMENT AMONG WOMEN WITH CHILDREN AGES 6 TO 17 YEARS
100.0/ 100
METRIC RATING
24th/ 347
METRIC RANK

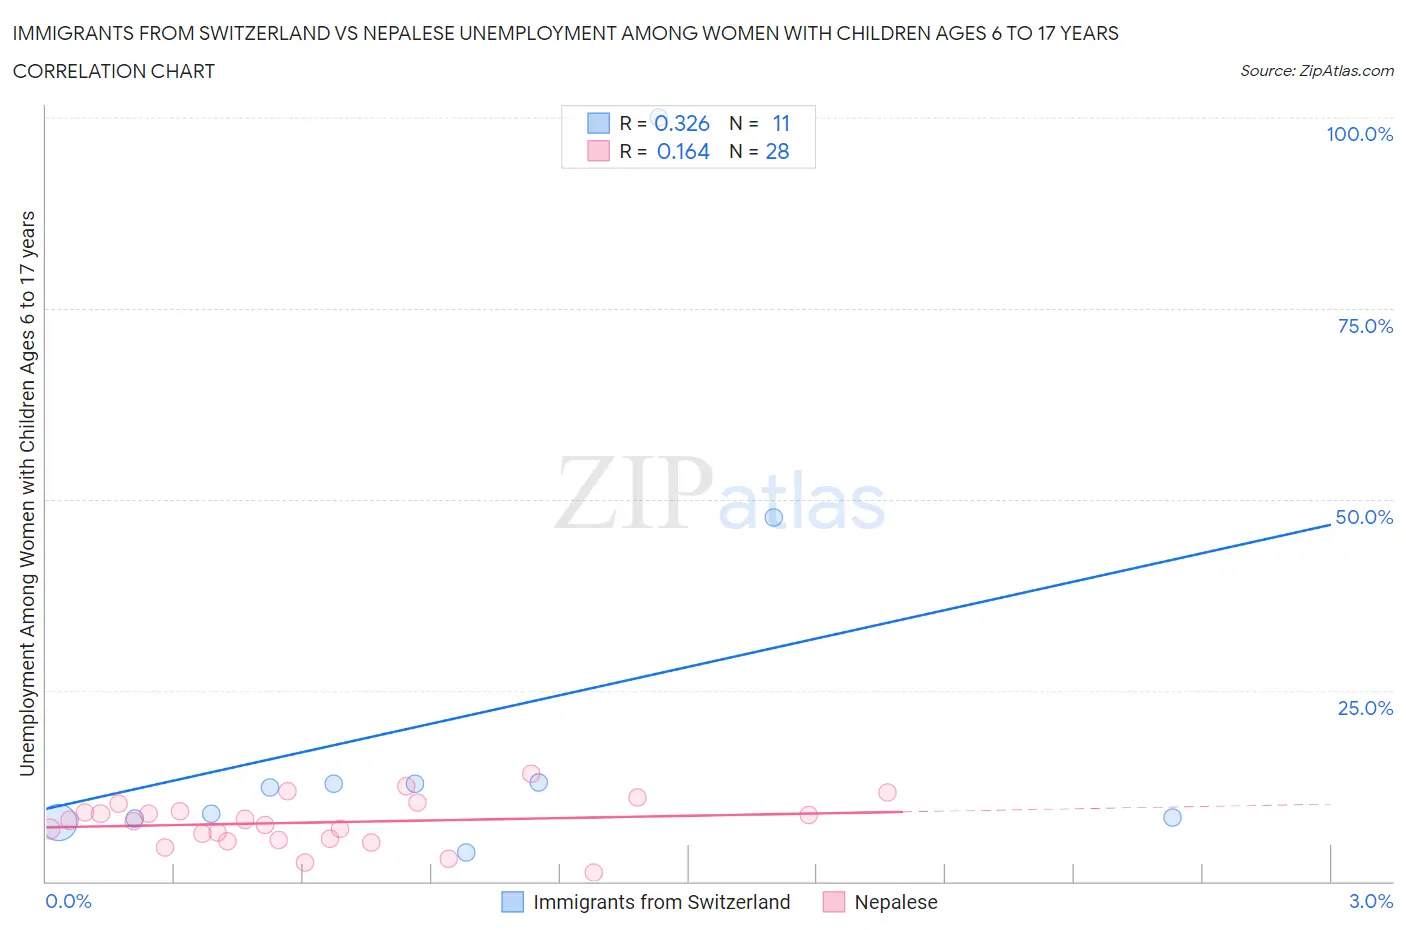
Immigrants from Switzerland vs Nepalese Unemployment Among Women with Children Ages 6 to 17 years Correlation Chart

The statistical analysis conducted on geographies consisting of 119,509,037 people shows a mild positive correlation between the proportion of Immigrants from Switzerland and unemployment rate among women with children between the ages 6 and 17 in the United States with a correlation coefficient (R) of 0.326 and weighted average of 8.1%. Similarly, the statistical analysis conducted on geographies consisting of 22,673,047 people shows a poor positive correlation between the proportion of Nepalese and unemployment rate among women with children between the ages 6 and 17 in the United States with a correlation coefficient (R) of 0.164 and weighted average of 7.7%, a difference of 4.6%.
Immigrants from Switzerland vs Nepalese Unemployment Among Women with Children Ages 6 to 17 years

Unemployment Among Women with Children Ages 6 to 17 years Correlation Summary

MeasurementImmigrants from SwitzerlandNepalese
Minimum3.8%1.1%
Maximum100.0%14.1%
Range96.2%13.0%
Mean21.4%7.7%
Median12.3%7.9%
Interquartile 25% (IQ1)8.2%5.4%
Interquartile 75% (IQ3)12.9%9.6%
Interquartile Range (IQR)4.7%4.2%
Standard Deviation (Sample)28.6%3.1%
Standard Deviation (Population)27.3%3.0%

Similar Demographics by Unemployment Among Women with Children Ages 6 to 17 years

Demographics Similar to Immigrants from Switzerland by Unemployment Among Women with Children Ages 6 to 17 years

In terms of unemployment among women with children ages 6 to 17 years, the demographic groups most similar to Immigrants from Switzerland are Icelander (8.1%, a difference of 0.040%), Immigrants from Bulgaria (8.1%, a difference of 0.060%), Immigrants from Sweden (8.1%, a difference of 0.10%), Immigrants from Asia (8.1%, a difference of 0.13%), and Bhutanese (8.1%, a difference of 0.14%).
DemographicsRating | RankUnemployment Among Women with Children Ages 6 to 17 years
Immigrants | Zimbabwe
100.0
/100
|
#40
Exceptional
8.0%
Iranians
100.0
/100
|
#41
Exceptional
8.0%
Immigrants | Somalia
100.0
/100
|
#42
Exceptional
8.0%
Bhutanese
100.0
/100
|
#43
Exceptional
8.1%
Immigrants | Sweden
100.0
/100
|
#44
Exceptional
8.1%
Immigrants | Bulgaria
100.0
/100
|
#45
Exceptional
8.1%
Icelanders
100.0
/100
|
#46
Exceptional
8.1%
Immigrants | Switzerland
100.0
/100
|
#47
Exceptional
8.1%
Immigrants | Asia
100.0
/100
|
#48
Exceptional
8.1%
Immigrants | Oceania
100.0
/100
|
#49
Exceptional
8.1%
Hawaiians
100.0
/100
|
#50
Exceptional
8.1%
Immigrants | Sudan
100.0
/100
|
#51
Exceptional
8.1%
Immigrants | Iraq
100.0
/100
|
#52
Exceptional
8.1%
Danes
100.0
/100
|
#53
Exceptional
8.1%
Immigrants | Armenia
100.0
/100
|
#54
Exceptional
8.2%

Demographics Similar to Nepalese by Unemployment Among Women with Children Ages 6 to 17 years

In terms of unemployment among women with children ages 6 to 17 years, the demographic groups most similar to Nepalese are Immigrants from Indonesia (7.7%, a difference of 0.010%), Immigrants from Eastern Asia (7.7%, a difference of 0.12%), Indian (Asian) (7.7%, a difference of 0.13%), Immigrants from China (7.7%, a difference of 0.39%), and Immigrants from India (7.7%, a difference of 0.68%).
DemographicsRating | RankUnemployment Among Women with Children Ages 6 to 17 years
Cambodians
100.0
/100
|
#17
Exceptional
7.5%
Afghans
100.0
/100
|
#18
Exceptional
7.6%
Filipinos
100.0
/100
|
#19
Exceptional
7.6%
Immigrants | Singapore
100.0
/100
|
#20
Exceptional
7.7%
Immigrants | India
100.0
/100
|
#21
Exceptional
7.7%
Immigrants | China
100.0
/100
|
#22
Exceptional
7.7%
Immigrants | Indonesia
100.0
/100
|
#23
Exceptional
7.7%
Nepalese
100.0
/100
|
#24
Exceptional
7.7%
Immigrants | Eastern Asia
100.0
/100
|
#25
Exceptional
7.7%
Indians (Asian)
100.0
/100
|
#26
Exceptional
7.7%
Immigrants | Afghanistan
100.0
/100
|
#27
Exceptional
7.8%
Immigrants | Uzbekistan
100.0
/100
|
#28
Exceptional
7.8%
Thais
100.0
/100
|
#29
Exceptional
7.8%
Immigrants | Iran
100.0
/100
|
#30
Exceptional
7.9%
Laotians
100.0
/100
|
#31
Exceptional
7.9%