Immigrants from Chile vs Immigrants from Eastern Africa Unemployment
COMPARE
Immigrants from Chile
Immigrants from Eastern Africa
Unemployment
Unemployment Comparison
Immigrants from Chile
Immigrants from Eastern Africa
5.1%
UNEMPLOYMENT
82.8/ 100
METRIC RATING
143rd/ 347
METRIC RANK
5.1%
UNEMPLOYMENT
88.1/ 100
METRIC RATING
128th/ 347
METRIC RANK
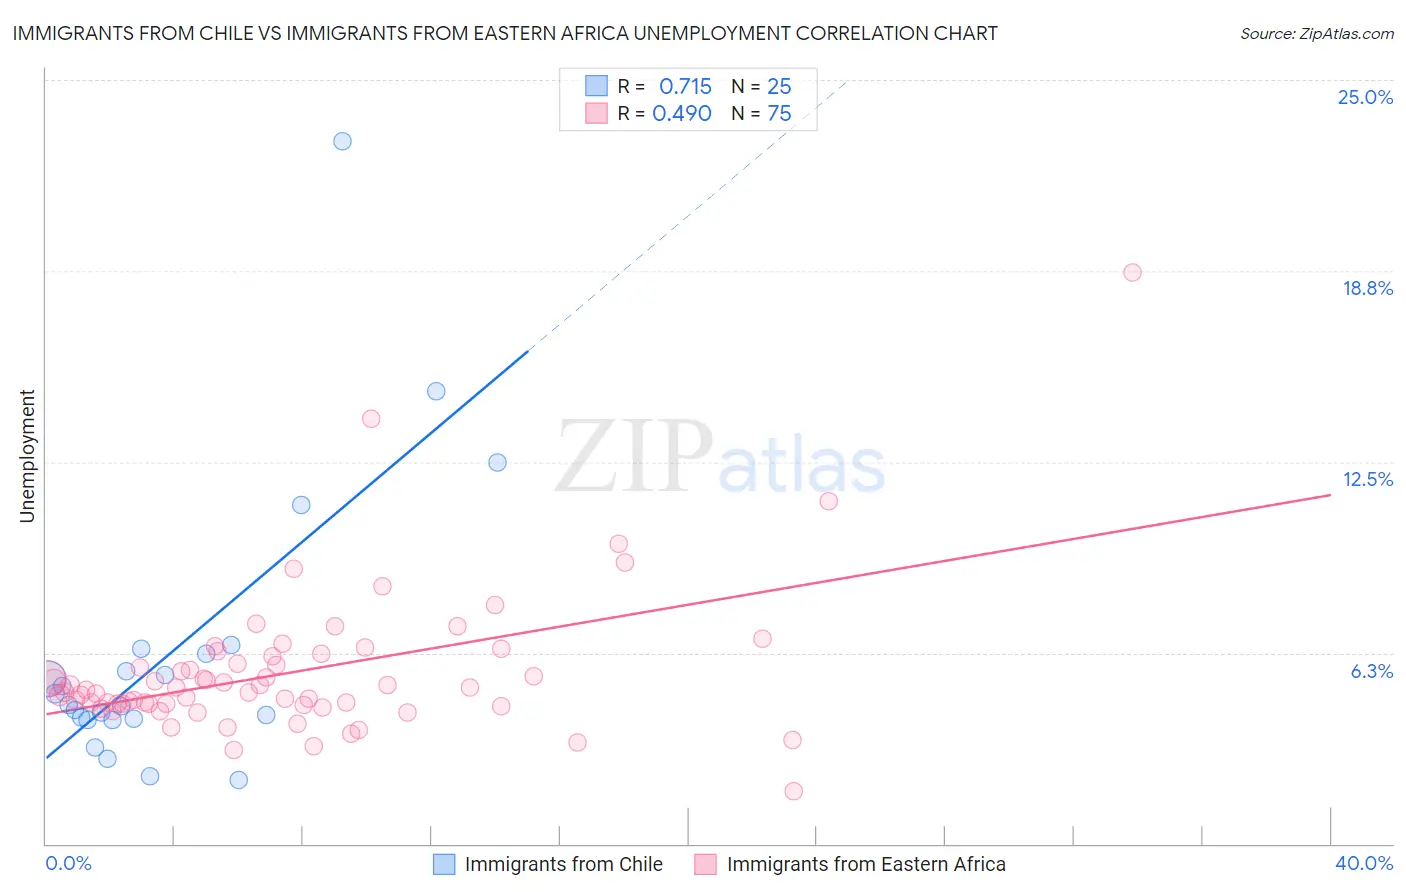
Immigrants from Chile vs Immigrants from Eastern Africa Unemployment Correlation Chart
The statistical analysis conducted on geographies consisting of 218,562,271 people shows a strong positive correlation between the proportion of Immigrants from Chile and unemployment in the United States with a correlation coefficient (R) of 0.715 and weighted average of 5.1%. Similarly, the statistical analysis conducted on geographies consisting of 354,902,578 people shows a moderate positive correlation between the proportion of Immigrants from Eastern Africa and unemployment in the United States with a correlation coefficient (R) of 0.490 and weighted average of 5.1%, a difference of 0.68%.
Unemployment Correlation Summary
| Measurement | Immigrants from Chile | Immigrants from Eastern Africa |
| Minimum | 2.1% | 1.7% |
| Maximum | 23.0% | 18.7% |
| Range | 20.9% | 17.0% |
| Mean | 6.2% | 5.6% |
| Median | 4.5% | 5.0% |
| Interquartile 25% (IQ1) | 4.1% | 4.6% |
| Interquartile 75% (IQ3) | 6.3% | 6.1% |
| Interquartile Range (IQR) | 2.2% | 1.6% |
| Standard Deviation (Sample) | 4.6% | 2.4% |
| Standard Deviation (Population) | 4.5% | 2.4% |
Demographics Similar to Immigrants from Chile and Immigrants from Eastern Africa by Unemployment
In terms of unemployment, the demographic groups most similar to Immigrants from Chile are Immigrants from Pakistan (5.1%, a difference of 0.050%), Indonesian (5.1%, a difference of 0.050%), Palestinian (5.1%, a difference of 0.070%), Immigrants from Norway (5.1%, a difference of 0.11%), and Immigrants from Denmark (5.1%, a difference of 0.17%). Similarly, the demographic groups most similar to Immigrants from Eastern Africa are Immigrants from Latvia (5.1%, a difference of 0.0%), Kenyan (5.1%, a difference of 0.020%), Immigrants from Kenya (5.1%, a difference of 0.020%), Immigrants from Eastern Asia (5.1%, a difference of 0.040%), and Iranian (5.1%, a difference of 0.16%).
| Demographics | Rating | Rank | Unemployment |
| Immigrants | Eastern Asia | 88.3 /100 | #125 | Excellent 5.1% |
| Kenyans | 88.2 /100 | #126 | Excellent 5.1% |
| Immigrants | Kenya | 88.2 /100 | #127 | Excellent 5.1% |
| Immigrants | Eastern Africa | 88.1 /100 | #128 | Excellent 5.1% |
| Immigrants | Latvia | 88.0 /100 | #129 | Excellent 5.1% |
| Iranians | 86.9 /100 | #130 | Excellent 5.1% |
| Immigrants | Croatia | 86.8 /100 | #131 | Excellent 5.1% |
| Immigrants | Ethiopia | 86.7 /100 | #132 | Excellent 5.1% |
| Immigrants | Jordan | 86.6 /100 | #133 | Excellent 5.1% |
| Immigrants | Europe | 86.3 /100 | #134 | Excellent 5.1% |
| Immigrants | Burma/Myanmar | 86.2 /100 | #135 | Excellent 5.1% |
| Immigrants | Spain | 86.2 /100 | #136 | Excellent 5.1% |
| Immigrants | Saudi Arabia | 85.6 /100 | #137 | Excellent 5.1% |
| Immigrants | Hungary | 85.6 /100 | #138 | Excellent 5.1% |
| Pakistanis | 85.3 /100 | #139 | Excellent 5.1% |
| Immigrants | Denmark | 84.3 /100 | #140 | Excellent 5.1% |
| Palestinians | 83.4 /100 | #141 | Excellent 5.1% |
| Immigrants | Pakistan | 83.2 /100 | #142 | Excellent 5.1% |
| Immigrants | Chile | 82.8 /100 | #143 | Excellent 5.1% |
| Indonesians | 82.3 /100 | #144 | Excellent 5.1% |
| Immigrants | Norway | 81.8 /100 | #145 | Excellent 5.1% |