Immigrants from Chile vs Immigrants from Eastern Africa Single Male Poverty

COMPARE

Immigrants from Chile
Race
Ancestry
AfghanAfricanAlaska NativeAlaskan AthabascanAlbanianAleutAlsatianAmericanApacheArabArapahoArgentineanArmenianAssyrian/Chaldean/SyriacAustralianAustrianBahamianBangladeshiBarbadianBasqueBelgianBelizeanBermudanBhutaneseBlackfeetBolivianBrazilianBritishBritish West IndianBulgarianBurmeseCajunCambodianCanadianCape VerdeanCarpatho RusynCelticCentral AmericanCentral American IndianCherokeeCheyenneChickasawChileanChineseChippewaChoctawColombianColvilleComancheCosta RicanCreeCreekCroatianCrowCubanCypriotCzechCzechoslovakianDanishDelawareDominicanDutchDutch West IndianEastern EuropeanEcuadorianEgyptianEnglishEstonianEthiopianEuropeanFijianFilipinoFinnishFrenchFrench American IndianFrench CanadianGermanGerman RussianGhanaianGreekGuamanian/ChamorroGuatemalanGuyaneseHaitianHmongHonduranHopiHoumaHungarianIcelanderIndian (Asian)IndonesianInupiatIranianIraqiIrishIroquoisIsraeliItalianJamaicanJapaneseJordanianKenyanKiowaKoreanLaotianLatvianLebaneseLiberianLithuanianLumbeeLuxembourgerMacedonianMalaysianMalteseMarshalleseMenomineeMexicanMexican American IndianMongolianMoroccanNative HawaiianNavajoNepaleseNew ZealanderNicaraguanNigerianNorthern EuropeanNorwegianOkinawanOsageOttawaPaiutePakistaniPalestinianPanamanianParaguayanPennsylvania GermanPeruvianPimaPolishPortuguesePotawatomiPuebloPuerto RicanPuget Sound SalishRomanianRussianSalvadoranSamoanScandinavianScotch-IrishScottishSeminoleSenegaleseSerbianShoshoneSierra LeoneanSiouxSlavicSlovakSloveneSomaliSouth AfricanSouth AmericanSouth American IndianSoviet UnionSpaniardSpanishSpanish AmericanSpanish American IndianSri LankanSubsaharan AfricanSudaneseSwedishSwissSyrianTaiwaneseThaiTlingit-HaidaTohono O'OdhamTonganTrinidadian and TobagonianTsimshianTurkishU.S. Virgin IslanderUgandanUkrainianUruguayanUteVenezuelanVietnameseWelshWest IndianYakamaYaquiYugoslavianYumanYup'ikZimbabwean
Immigration
NonimmigrantsImmigrantsAfghanistanAfricaAlbaniaArgentinaArmeniaAsiaAustraliaAustriaBahamasBangladeshBarbadosBelarusBelgiumBelizeBoliviaBosnia and HerzegovinaBrazilBulgariaBurma/MyanmarCabo VerdeCambodiaCameroonCanadaCaribbeanCentral AmericaChileChinaColombiaCongoCosta RicaCroatiaCubaCzechoslovakiaDenmarkDominicaDominican RepublicEastern AsiaEastern EuropeEcuadorEgyptEl SalvadorEnglandEritreaEthiopiaEuropeFijiFranceGermanyGhanaGreeceGrenadaGuatemalaGuyanaHaitiHondurasHong KongHungaryIndiaIndonesiaIranIraqIrelandIsraelItalyJamaicaJapanJordanKazakhstanKenyaKoreaKuwaitLaosLatin AmericaLatviaLebanonLiberiaLithuaniaMalaysiaMexicoMicronesiaMiddle AfricaMoldovaMoroccoNepalNetherlandsNicaraguaNigeriaNorth AmericaNorth MacedoniaNorthern AfricaNorthern EuropeNorwayOceaniaPakistanPanamaPeruPhilippinesPolandPortugalRomaniaRussiaSaudi ArabiaScotlandSenegalSerbiaSierra LeoneSingaporeSomaliaSouth AfricaSouth AmericaSouth Central AsiaSouth Eastern AsiaSouthern EuropeSpainSri LankaSt. Vincent and the GrenadinesSudanSwedenSwitzerlandSyriaTaiwanThailandTrinidad and TobagoTurkeyUgandaUkraineUruguayUzbekistanVenezuelaVietnamWest IndiesWestern AfricaWestern AsiaWestern EuropeYemenZaireZimbabweAzores
Immigrants from Eastern Africa
Race
Ancestry
AfghanAfricanAlaska NativeAlaskan AthabascanAlbanianAleutAlsatianAmericanApacheArabArapahoArgentineanArmenianAssyrian/Chaldean/SyriacAustralianAustrianBahamianBangladeshiBarbadianBasqueBelgianBelizeanBermudanBhutaneseBlackfeetBolivianBrazilianBritishBritish West IndianBulgarianBurmeseCajunCambodianCanadianCape VerdeanCarpatho RusynCelticCentral AmericanCentral American IndianCherokeeCheyenneChickasawChileanChineseChippewaChoctawColombianColvilleComancheCosta RicanCreeCreekCroatianCrowCubanCypriotCzechCzechoslovakianDanishDelawareDominicanDutchDutch West IndianEastern EuropeanEcuadorianEgyptianEnglishEstonianEthiopianEuropeanFijianFilipinoFinnishFrenchFrench American IndianFrench CanadianGermanGerman RussianGhanaianGreekGuamanian/ChamorroGuatemalanGuyaneseHaitianHmongHonduranHopiHoumaHungarianIcelanderIndian (Asian)IndonesianInupiatIranianIraqiIrishIroquoisIsraeliItalianJamaicanJapaneseJordanianKenyanKiowaKoreanLaotianLatvianLebaneseLiberianLithuanianLumbeeLuxembourgerMacedonianMalaysianMalteseMarshalleseMenomineeMexicanMexican American IndianMongolianMoroccanNative HawaiianNavajoNepaleseNew ZealanderNicaraguanNigerianNorthern EuropeanNorwegianOkinawanOsageOttawaPaiutePakistaniPalestinianPanamanianParaguayanPennsylvania GermanPeruvianPimaPolishPortuguesePotawatomiPuebloPuerto RicanPuget Sound SalishRomanianRussianSalvadoranSamoanScandinavianScotch-IrishScottishSeminoleSenegaleseSerbianShoshoneSierra LeoneanSiouxSlavicSlovakSloveneSomaliSouth AfricanSouth AmericanSouth American IndianSoviet UnionSpaniardSpanishSpanish AmericanSpanish American IndianSri LankanSubsaharan AfricanSudaneseSwedishSwissSyrianTaiwaneseThaiTlingit-HaidaTohono O'OdhamTonganTrinidadian and TobagonianTsimshianTurkishU.S. Virgin IslanderUgandanUkrainianUruguayanUteVenezuelanVietnameseWelshWest IndianYakamaYaquiYugoslavianYumanYup'ikZimbabwean
Immigration
NonimmigrantsImmigrantsAfghanistanAfricaAlbaniaArgentinaArmeniaAsiaAustraliaAustriaBahamasBangladeshBarbadosBelarusBelgiumBelizeBoliviaBosnia and HerzegovinaBrazilBulgariaBurma/MyanmarCabo VerdeCambodiaCameroonCanadaCaribbeanCentral AmericaChinaColombiaCongoCosta RicaCroatiaCubaCzechoslovakiaDenmarkDominicaDominican RepublicEastern AfricaEastern AsiaEastern EuropeEcuadorEgyptEl SalvadorEnglandEritreaEthiopiaEuropeFijiFranceGermanyGhanaGreeceGrenadaGuatemalaGuyanaHaitiHondurasHong KongHungaryIndiaIndonesiaIranIraqIrelandIsraelItalyJamaicaJapanJordanKazakhstanKenyaKoreaKuwaitLaosLatin AmericaLatviaLebanonLiberiaLithuaniaMalaysiaMexicoMicronesiaMiddle AfricaMoldovaMoroccoNepalNetherlandsNicaraguaNigeriaNorth AmericaNorth MacedoniaNorthern AfricaNorthern EuropeNorwayOceaniaPakistanPanamaPeruPhilippinesPolandPortugalRomaniaRussiaSaudi ArabiaScotlandSenegalSerbiaSierra LeoneSingaporeSomaliaSouth AfricaSouth AmericaSouth Central AsiaSouth Eastern AsiaSouthern EuropeSpainSri LankaSt. Vincent and the GrenadinesSudanSwedenSwitzerlandSyriaTaiwanThailandTrinidad and TobagoTurkeyUgandaUkraineUruguayUzbekistanVenezuelaVietnamWest IndiesWestern AfricaWestern AsiaWestern EuropeYemenZaireZimbabweAzores
Single Male Poverty
Income
Poverty
Unemployment
Labor Participation
Family Structure
Vehicle Availability
Education Level
Disability

Single Male Poverty Comparison

Immigrants from Chile

Immigrants from Eastern Africa

Exceptional
Exceptional
12.1%
SINGLE MALE POVERTY
98.6/ 100
METRIC RATING
83rd/ 347
METRIC RANK
12.3%
SINGLE MALE POVERTY
95.0/ 100
METRIC RATING
108th/ 347
METRIC RANK

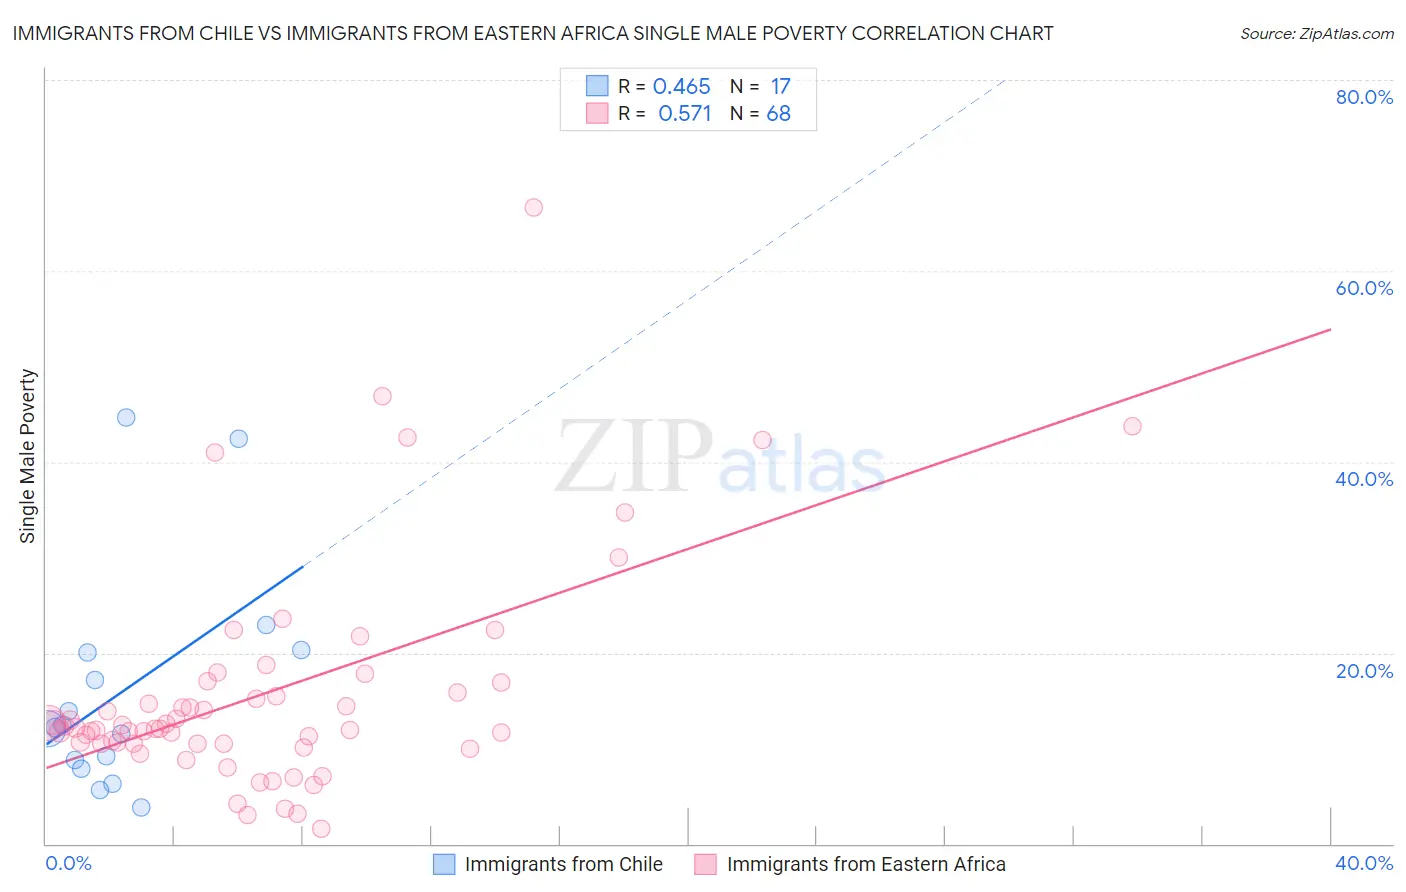
Immigrants from Chile vs Immigrants from Eastern Africa Single Male Poverty Correlation Chart

The statistical analysis conducted on geographies consisting of 202,893,830 people shows a moderate positive correlation between the proportion of Immigrants from Chile and poverty level among single males in the United States with a correlation coefficient (R) of 0.465 and weighted average of 12.1%. Similarly, the statistical analysis conducted on geographies consisting of 319,633,400 people shows a substantial positive correlation between the proportion of Immigrants from Eastern Africa and poverty level among single males in the United States with a correlation coefficient (R) of 0.571 and weighted average of 12.3%, a difference of 1.8%.
Immigrants from Chile vs Immigrants from Eastern Africa Single Male Poverty

Single Male Poverty Correlation Summary

MeasurementImmigrants from ChileImmigrants from Eastern Africa
Minimum3.8%1.5%
Maximum44.7%66.7%
Range40.9%65.1%
Mean15.9%15.7%
Median12.2%12.1%
Interquartile 25% (IQ1)8.3%10.5%
Interquartile 75% (IQ3)20.2%16.3%
Interquartile Range (IQR)11.9%5.9%
Standard Deviation (Sample)11.7%11.6%
Standard Deviation (Population)11.3%11.6%

Similar Demographics by Single Male Poverty

Demographics Similar to Immigrants from Chile by Single Male Poverty

In terms of single male poverty, the demographic groups most similar to Immigrants from Chile are Immigrants from Colombia (12.1%, a difference of 0.0%), Immigrants from Czechoslovakia (12.1%, a difference of 0.020%), Immigrants from South America (12.1%, a difference of 0.060%), Armenian (12.1%, a difference of 0.080%), and Turkish (12.1%, a difference of 0.10%).
DemographicsRating | RankSingle Male Poverty
Immigrants | Northern Africa
99.4
/100
|
#76
Exceptional
11.9%
Immigrants | Malaysia
99.2
/100
|
#77
Exceptional
12.0%
Immigrants | Venezuela
99.1
/100
|
#78
Exceptional
12.0%
Immigrants | Belgium
99.0
/100
|
#79
Exceptional
12.0%
Armenians
98.7
/100
|
#80
Exceptional
12.1%
Immigrants | South America
98.7
/100
|
#81
Exceptional
12.1%
Immigrants | Colombia
98.6
/100
|
#82
Exceptional
12.1%
Immigrants | Chile
98.6
/100
|
#83
Exceptional
12.1%
Immigrants | Czechoslovakia
98.6
/100
|
#84
Exceptional
12.1%
Turks
98.5
/100
|
#85
Exceptional
12.1%
Immigrants | Israel
98.5
/100
|
#86
Exceptional
12.1%
South Americans
98.5
/100
|
#87
Exceptional
12.1%
Immigrants | Eritrea
98.5
/100
|
#88
Exceptional
12.1%
Immigrants | Ireland
98.3
/100
|
#89
Exceptional
12.1%
South American Indians
98.3
/100
|
#90
Exceptional
12.1%

Demographics Similar to Immigrants from Eastern Africa by Single Male Poverty

In terms of single male poverty, the demographic groups most similar to Immigrants from Eastern Africa are Iraqi (12.3%, a difference of 0.020%), Ugandan (12.3%, a difference of 0.13%), Immigrants from Morocco (12.3%, a difference of 0.20%), Jordanian (12.3%, a difference of 0.28%), and Immigrants from Portugal (12.3%, a difference of 0.36%).
DemographicsRating | RankSingle Male Poverty
Immigrants | Latvia
97.0
/100
|
#101
Exceptional
12.2%
Immigrants | Europe
97.0
/100
|
#102
Exceptional
12.2%
Immigrants | Armenia
96.7
/100
|
#103
Exceptional
12.2%
Immigrants | Kazakhstan
96.7
/100
|
#104
Exceptional
12.2%
Jordanians
95.9
/100
|
#105
Exceptional
12.3%
Immigrants | Morocco
95.6
/100
|
#106
Exceptional
12.3%
Iraqis
95.1
/100
|
#107
Exceptional
12.3%
Immigrants | Eastern Africa
95.0
/100
|
#108
Exceptional
12.3%
Ugandans
94.5
/100
|
#109
Exceptional
12.3%
Immigrants | Portugal
93.6
/100
|
#110
Exceptional
12.3%
Immigrants | North Macedonia
93.6
/100
|
#111
Exceptional
12.3%
Kenyans
93.3
/100
|
#112
Exceptional
12.4%
Pakistanis
92.4
/100
|
#113
Exceptional
12.4%
Nicaraguans
92.1
/100
|
#114
Exceptional
12.4%
Immigrants | Southern Europe
91.5
/100
|
#115
Exceptional
12.4%