Immigrants from Western Africa vs Immigrants from Eastern Africa Unemployment

COMPARE

Immigrants from Western Africa
Race
Ancestry
AfghanAfricanAlaska NativeAlaskan AthabascanAlbanianAleutAlsatianAmericanApacheArabArapahoArgentineanArmenianAssyrian/Chaldean/SyriacAustralianAustrianBahamianBangladeshiBarbadianBasqueBelgianBelizeanBermudanBhutaneseBlackfeetBolivianBrazilianBritishBritish West IndianBulgarianBurmeseCajunCambodianCanadianCape VerdeanCarpatho RusynCelticCentral AmericanCentral American IndianCherokeeCheyenneChickasawChileanChineseChippewaChoctawColombianColvilleComancheCosta RicanCreeCreekCroatianCrowCubanCypriotCzechCzechoslovakianDanishDelawareDominicanDutchDutch West IndianEastern EuropeanEcuadorianEgyptianEnglishEstonianEthiopianEuropeanFijianFilipinoFinnishFrenchFrench American IndianFrench CanadianGermanGerman RussianGhanaianGreekGuamanian/ChamorroGuatemalanGuyaneseHaitianHmongHonduranHopiHoumaHungarianIcelanderIndian (Asian)IndonesianInupiatIranianIraqiIrishIroquoisIsraeliItalianJamaicanJapaneseJordanianKenyanKiowaKoreanLaotianLatvianLebaneseLiberianLithuanianLumbeeLuxembourgerMacedonianMalaysianMalteseMarshalleseMenomineeMexicanMexican American IndianMongolianMoroccanNative HawaiianNavajoNepaleseNew ZealanderNicaraguanNigerianNorthern EuropeanNorwegianOkinawanOsageOttawaPaiutePakistaniPalestinianPanamanianParaguayanPennsylvania GermanPeruvianPimaPolishPortuguesePotawatomiPuebloPuerto RicanPuget Sound SalishRomanianRussianSalvadoranSamoanScandinavianScotch-IrishScottishSeminoleSenegaleseSerbianShoshoneSierra LeoneanSiouxSlavicSlovakSloveneSomaliSouth AfricanSouth AmericanSouth American IndianSoviet UnionSpaniardSpanishSpanish AmericanSpanish American IndianSri LankanSubsaharan AfricanSudaneseSwedishSwissSyrianTaiwaneseThaiTlingit-HaidaTohono O'OdhamTonganTrinidadian and TobagonianTsimshianTurkishU.S. Virgin IslanderUgandanUkrainianUruguayanUteVenezuelanVietnameseWelshWest IndianYakamaYaquiYugoslavianYumanYup'ikZimbabwean
Immigration
NonimmigrantsImmigrantsAfghanistanAfricaAlbaniaArgentinaArmeniaAsiaAustraliaAustriaBahamasBangladeshBarbadosBelarusBelgiumBelizeBoliviaBosnia and HerzegovinaBrazilBulgariaBurma/MyanmarCabo VerdeCambodiaCameroonCanadaCaribbeanCentral AmericaChileChinaColombiaCongoCosta RicaCroatiaCubaCzechoslovakiaDenmarkDominicaDominican RepublicEastern AsiaEastern EuropeEcuadorEgyptEl SalvadorEnglandEritreaEthiopiaEuropeFijiFranceGermanyGhanaGreeceGrenadaGuatemalaGuyanaHaitiHondurasHong KongHungaryIndiaIndonesiaIranIraqIrelandIsraelItalyJamaicaJapanJordanKazakhstanKenyaKoreaKuwaitLaosLatin AmericaLatviaLebanonLiberiaLithuaniaMalaysiaMexicoMicronesiaMiddle AfricaMoldovaMoroccoNepalNetherlandsNicaraguaNigeriaNorth AmericaNorth MacedoniaNorthern AfricaNorthern EuropeNorwayOceaniaPakistanPanamaPeruPhilippinesPolandPortugalRomaniaRussiaSaudi ArabiaScotlandSenegalSerbiaSierra LeoneSingaporeSomaliaSouth AfricaSouth AmericaSouth Central AsiaSouth Eastern AsiaSouthern EuropeSpainSri LankaSt. Vincent and the GrenadinesSudanSwedenSwitzerlandSyriaTaiwanThailandTrinidad and TobagoTurkeyUgandaUkraineUruguayUzbekistanVenezuelaVietnamWest IndiesWestern AfricaWestern AsiaWestern EuropeYemenZaireZimbabweAzores
Immigrants from Eastern Africa
Race
Ancestry
AfghanAfricanAlaska NativeAlaskan AthabascanAlbanianAleutAlsatianAmericanApacheArabArapahoArgentineanArmenianAssyrian/Chaldean/SyriacAustralianAustrianBahamianBangladeshiBarbadianBasqueBelgianBelizeanBermudanBhutaneseBlackfeetBolivianBrazilianBritishBritish West IndianBulgarianBurmeseCajunCambodianCanadianCape VerdeanCarpatho RusynCelticCentral AmericanCentral American IndianCherokeeCheyenneChickasawChileanChineseChippewaChoctawColombianColvilleComancheCosta RicanCreeCreekCroatianCrowCubanCypriotCzechCzechoslovakianDanishDelawareDominicanDutchDutch West IndianEastern EuropeanEcuadorianEgyptianEnglishEstonianEthiopianEuropeanFijianFilipinoFinnishFrenchFrench American IndianFrench CanadianGermanGerman RussianGhanaianGreekGuamanian/ChamorroGuatemalanGuyaneseHaitianHmongHonduranHopiHoumaHungarianIcelanderIndian (Asian)IndonesianInupiatIranianIraqiIrishIroquoisIsraeliItalianJamaicanJapaneseJordanianKenyanKiowaKoreanLaotianLatvianLebaneseLiberianLithuanianLumbeeLuxembourgerMacedonianMalaysianMalteseMarshalleseMenomineeMexicanMexican American IndianMongolianMoroccanNative HawaiianNavajoNepaleseNew ZealanderNicaraguanNigerianNorthern EuropeanNorwegianOkinawanOsageOttawaPaiutePakistaniPalestinianPanamanianParaguayanPennsylvania GermanPeruvianPimaPolishPortuguesePotawatomiPuebloPuerto RicanPuget Sound SalishRomanianRussianSalvadoranSamoanScandinavianScotch-IrishScottishSeminoleSenegaleseSerbianShoshoneSierra LeoneanSiouxSlavicSlovakSloveneSomaliSouth AfricanSouth AmericanSouth American IndianSoviet UnionSpaniardSpanishSpanish AmericanSpanish American IndianSri LankanSubsaharan AfricanSudaneseSwedishSwissSyrianTaiwaneseThaiTlingit-HaidaTohono O'OdhamTonganTrinidadian and TobagonianTsimshianTurkishU.S. Virgin IslanderUgandanUkrainianUruguayanUteVenezuelanVietnameseWelshWest IndianYakamaYaquiYugoslavianYumanYup'ikZimbabwean
Immigration
NonimmigrantsImmigrantsAfghanistanAfricaAlbaniaArgentinaArmeniaAsiaAustraliaAustriaBahamasBangladeshBarbadosBelarusBelgiumBelizeBoliviaBosnia and HerzegovinaBrazilBulgariaBurma/MyanmarCabo VerdeCambodiaCameroonCanadaCaribbeanCentral AmericaChileChinaColombiaCongoCosta RicaCroatiaCubaCzechoslovakiaDenmarkDominicaDominican RepublicEastern AfricaEastern AsiaEastern EuropeEcuadorEgyptEl SalvadorEnglandEritreaEthiopiaEuropeFijiFranceGermanyGhanaGreeceGrenadaGuatemalaGuyanaHaitiHondurasHong KongHungaryIndiaIndonesiaIranIraqIrelandIsraelItalyJamaicaJapanJordanKazakhstanKenyaKoreaKuwaitLaosLatin AmericaLatviaLebanonLiberiaLithuaniaMalaysiaMexicoMicronesiaMiddle AfricaMoldovaMoroccoNepalNetherlandsNicaraguaNigeriaNorth AmericaNorth MacedoniaNorthern AfricaNorthern EuropeNorwayOceaniaPakistanPanamaPeruPhilippinesPolandPortugalRomaniaRussiaSaudi ArabiaScotlandSenegalSerbiaSierra LeoneSingaporeSomaliaSouth AfricaSouth AmericaSouth Central AsiaSouth Eastern AsiaSouthern EuropeSpainSri LankaSt. Vincent and the GrenadinesSudanSwedenSwitzerlandSyriaTaiwanThailandTrinidad and TobagoTurkeyUgandaUkraineUruguayUzbekistanVenezuelaVietnamWest IndiesWestern AsiaWestern EuropeYemenZaireZimbabweAzores
Unemployment
Income
Poverty
Unemployment
Labor Participation
Family Structure
Vehicle Availability
Education Level
Disability

Unemployment Comparison

Immigrants from Western Africa

Immigrants from Eastern Africa

Tragic
Excellent
6.0%
UNEMPLOYMENT
0.0/ 100
METRIC RATING
280th/ 347
METRIC RANK
5.1%
UNEMPLOYMENT
88.1/ 100
METRIC RATING
128th/ 347
METRIC RANK

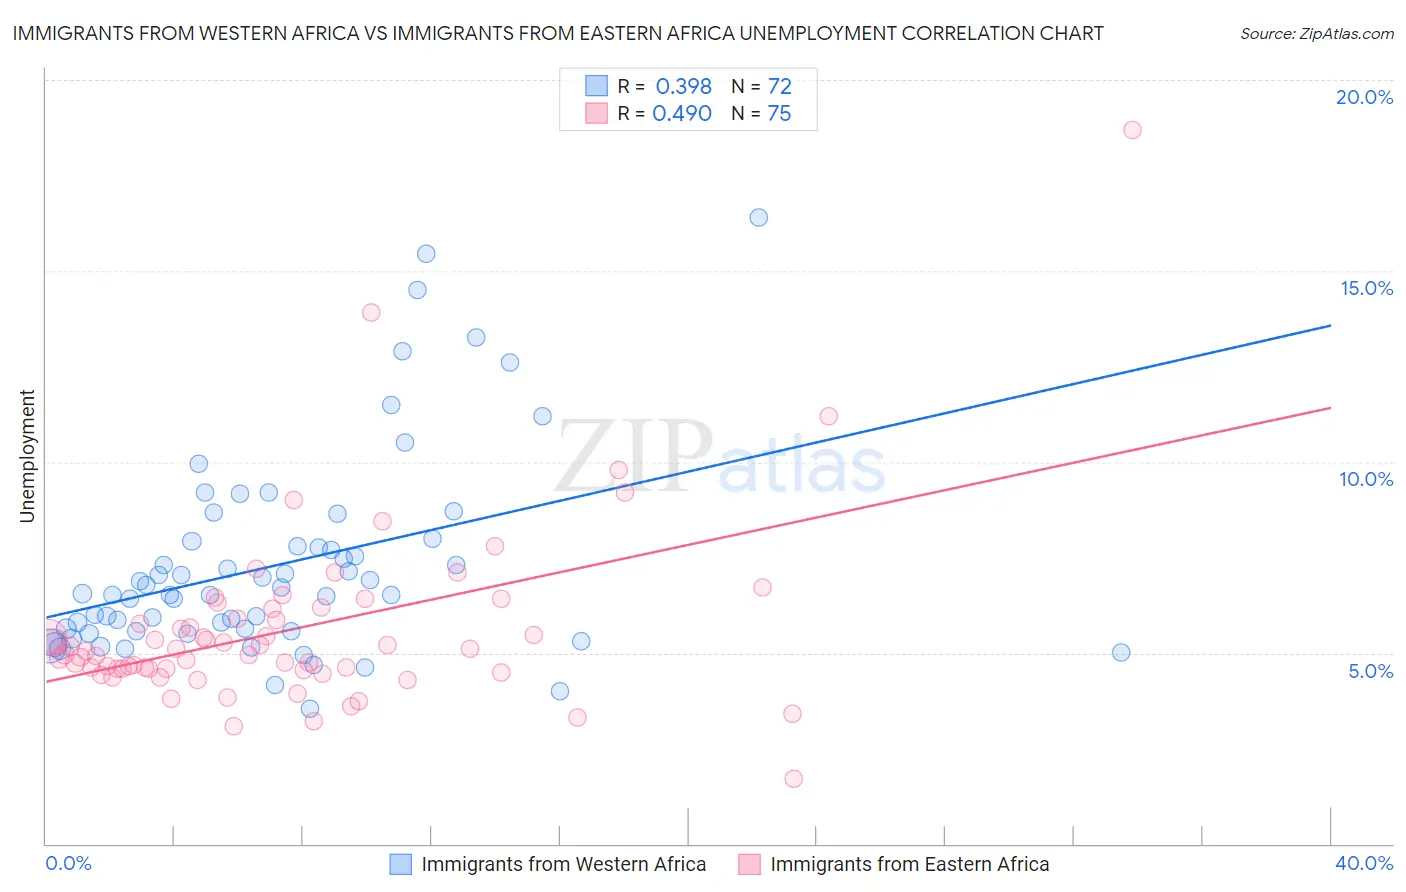
Immigrants from Western Africa vs Immigrants from Eastern Africa Unemployment Correlation Chart

The statistical analysis conducted on geographies consisting of 357,683,143 people shows a mild positive correlation between the proportion of Immigrants from Western Africa and unemployment in the United States with a correlation coefficient (R) of 0.398 and weighted average of 6.0%. Similarly, the statistical analysis conducted on geographies consisting of 354,902,578 people shows a moderate positive correlation between the proportion of Immigrants from Eastern Africa and unemployment in the United States with a correlation coefficient (R) of 0.490 and weighted average of 5.1%, a difference of 18.1%.
Immigrants from Western Africa vs Immigrants from Eastern Africa Unemployment

Unemployment Correlation Summary

MeasurementImmigrants from Western AfricaImmigrants from Eastern Africa
Minimum3.5%1.7%
Maximum16.4%18.7%
Range12.9%17.0%
Mean7.3%5.6%
Median6.5%5.0%
Interquartile 25% (IQ1)5.6%4.6%
Interquartile 75% (IQ3)7.9%6.1%
Interquartile Range (IQR)2.3%1.6%
Standard Deviation (Sample)2.7%2.4%
Standard Deviation (Population)2.6%2.4%

Similar Demographics by Unemployment

Demographics Similar to Immigrants from Western Africa by Unemployment

In terms of unemployment, the demographic groups most similar to Immigrants from Western Africa are Immigrants from Mexico (6.0%, a difference of 0.0%), Ghanaian (6.0%, a difference of 0.43%), African (6.1%, a difference of 0.58%), Immigrants from the Azores (6.1%, a difference of 0.64%), and Armenian (6.0%, a difference of 0.73%).
DemographicsRating | RankUnemployment
Immigrants | Fiji
0.0
/100
|
#273
Tragic
5.9%
Bahamians
0.0
/100
|
#274
Tragic
5.9%
Immigrants | Latin America
0.0
/100
|
#275
Tragic
5.9%
Immigrants | Central America
0.0
/100
|
#276
Tragic
6.0%
Armenians
0.0
/100
|
#277
Tragic
6.0%
Ghanaians
0.0
/100
|
#278
Tragic
6.0%
Immigrants | Mexico
0.0
/100
|
#279
Tragic
6.0%
Immigrants | Western Africa
0.0
/100
|
#280
Tragic
6.0%
Africans
0.0
/100
|
#281
Tragic
6.1%
Immigrants | Azores
0.0
/100
|
#282
Tragic
6.1%
Immigrants | Ghana
0.0
/100
|
#283
Tragic
6.1%
Aleuts
0.0
/100
|
#284
Tragic
6.1%
Immigrants | Senegal
0.0
/100
|
#285
Tragic
6.1%
Immigrants | Caribbean
0.0
/100
|
#286
Tragic
6.2%
Nepalese
0.0
/100
|
#287
Tragic
6.2%

Demographics Similar to Immigrants from Eastern Africa by Unemployment

In terms of unemployment, the demographic groups most similar to Immigrants from Eastern Africa are Immigrants from Latvia (5.1%, a difference of 0.0%), Kenyan (5.1%, a difference of 0.020%), Immigrants from Kenya (5.1%, a difference of 0.020%), Immigrants from Eastern Asia (5.1%, a difference of 0.040%), and Ethiopian (5.1%, a difference of 0.090%).
DemographicsRating | RankUnemployment
Lebanese
89.2
/100
|
#121
Excellent
5.1%
Immigrants | Switzerland
89.1
/100
|
#122
Excellent
5.1%
Asians
89.0
/100
|
#123
Excellent
5.1%
Ethiopians
88.6
/100
|
#124
Excellent
5.1%
Immigrants | Eastern Asia
88.3
/100
|
#125
Excellent
5.1%
Kenyans
88.2
/100
|
#126
Excellent
5.1%
Immigrants | Kenya
88.2
/100
|
#127
Excellent
5.1%
Immigrants | Eastern Africa
88.1
/100
|
#128
Excellent
5.1%
Immigrants | Latvia
88.0
/100
|
#129
Excellent
5.1%
Iranians
86.9
/100
|
#130
Excellent
5.1%
Immigrants | Croatia
86.8
/100
|
#131
Excellent
5.1%
Immigrants | Ethiopia
86.7
/100
|
#132
Excellent
5.1%
Immigrants | Jordan
86.6
/100
|
#133
Excellent
5.1%
Immigrants | Europe
86.3
/100
|
#134
Excellent
5.1%
Immigrants | Burma/Myanmar
86.2
/100
|
#135
Excellent
5.1%