Zip Codes with the Highest Percentage of Households with Income Below $10,000 in Sevierville, TN
RELATED REPORTS & OPTIONS
Household Income | $0-10k
Sevierville
Compare Zip Codes
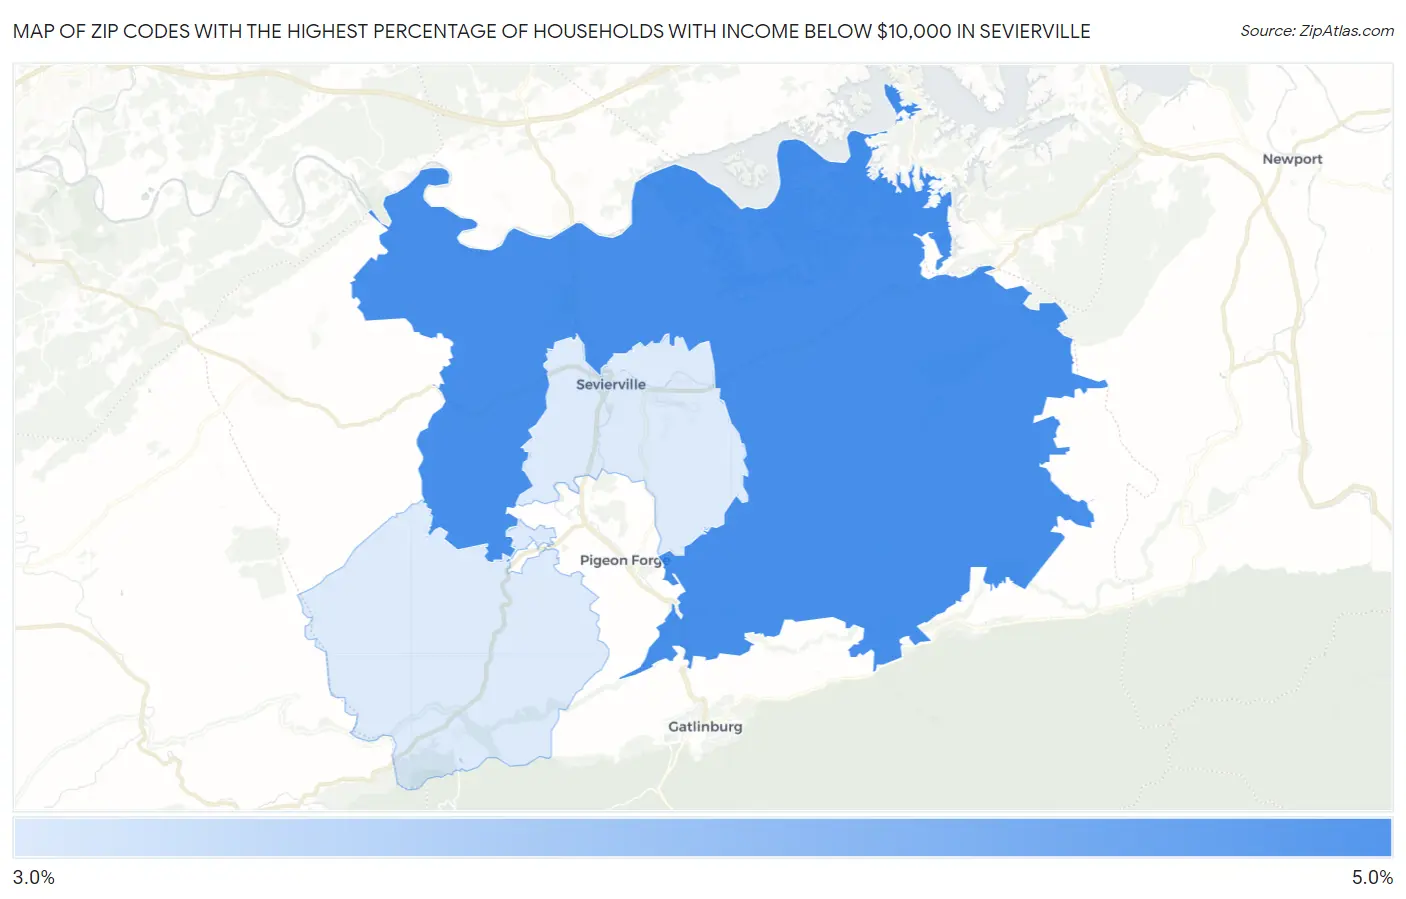
Map of Zip Codes with the Highest Percentage of Households with Income Below $10,000 in Sevierville
0.0%
5.0%
Zip Codes with the Highest Percentage of Households with Income Below $10,000 in Sevierville, TN
| Zip Code | Households with Income < $10k | vs State | vs National | |
| 1. | 37876 | 4.6% | 5.3%(-0.700)#303 | 4.9%(-0.300)#13,011 |
| 2. | 37862 | 3.3% | 5.3%(-2.00)#403 | 4.9%(-1.60)#18,131 |
1
Common Questions
What are the Top Zip Codes with the Highest Percentage of Households with Income Below $10,000 in Sevierville, TN?
Top Zip Codes with the Highest Percentage of Households with Income Below $10,000 in Sevierville, TN are:
What zip code has the Highest Percentage of Households with Income Below $10,000 in Sevierville, TN?
37876 has the Highest Percentage of Households with Income Below $10,000 in Sevierville, TN with 4.6%.
What is the Percentage of Households with Income Below $10,000 in Sevierville, TN?
Percentage of Households with Income Below $10,000 in Sevierville is 2.7%.
What is the Percentage of Households with Income Below $10,000 in Tennessee?
Percentage of Households with Income Below $10,000 in Tennessee is 5.3%.
What is the Percentage of Households with Income Below $10,000 in the United States?
Percentage of Households with Income Below $10,000 in the United States is 4.9%.