Zip Codes with the Highest Percentage of Population Employed in Health Care & Social Assistance in Seneca, SC
RELATED REPORTS & OPTIONS
Health Care & Social Assistance
Seneca
Compare Zip Codes
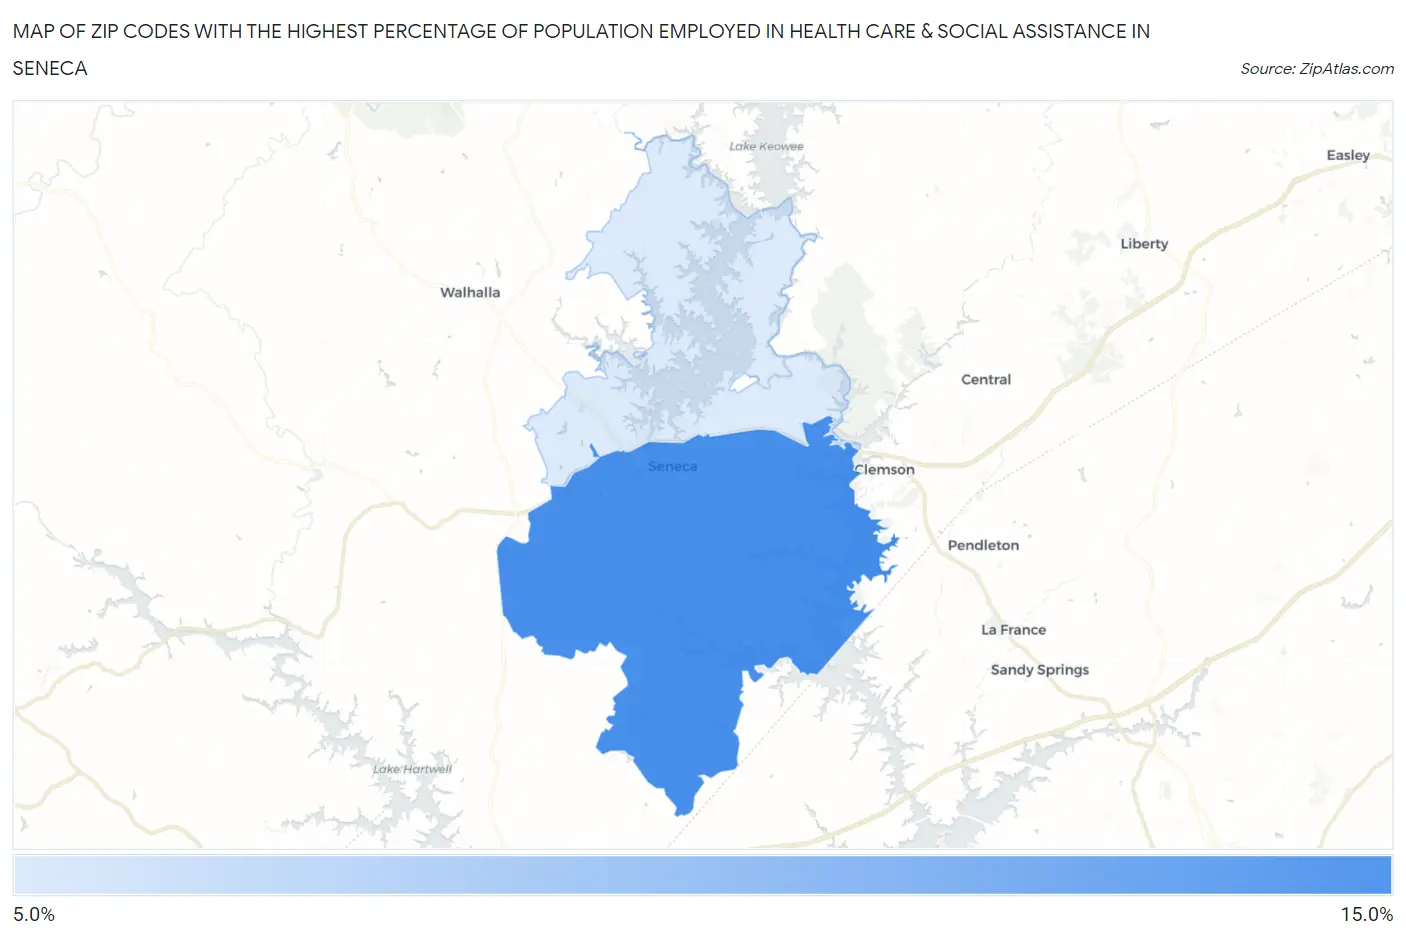
Map of Zip Codes with the Highest Percentage of Population Employed in Health Care & Social Assistance in Seneca
0.0%
15.0%
Zip Codes with the Highest Percentage of Population Employed in Health Care & Social Assistance in Seneca, SC
| Zip Code | % Employed | vs State | vs National | |
| 1. | 29678 | 13.3% | 13.1%(+0.255)#178 | 13.9%(-0.596)#15,682 |
| 2. | 29672 | 11.1% | 13.1%(-1.95)#262 | 13.9%(-2.80)#21,051 |
1
Common Questions
What are the Top Zip Codes with the Highest Percentage of Population Employed in Health Care & Social Assistance in Seneca, SC?
Top Zip Codes with the Highest Percentage of Population Employed in Health Care & Social Assistance in Seneca, SC are:
What zip code has the Highest Percentage of Population Employed in Health Care & Social Assistance in Seneca, SC?
29678 has the Highest Percentage of Population Employed in Health Care & Social Assistance in Seneca, SC with 13.3%.
What is the Percentage of Population Employed in Health Care & Social Assistance in Seneca, SC?
Percentage of Population Employed in Health Care & Social Assistance in Seneca is 14.7%.
What is the Percentage of Population Employed in Health Care & Social Assistance in South Carolina?
Percentage of Population Employed in Health Care & Social Assistance in South Carolina is 13.1%.
What is the Percentage of Population Employed in Health Care & Social Assistance in the United States?
Percentage of Population Employed in Health Care & Social Assistance in the United States is 13.9%.