Zimbabwean vs Navajo Single Female Poverty

COMPARE

Zimbabwean
Race
Ancestry
AfghanAfricanAlaska NativeAlaskan AthabascanAlbanianAleutAlsatianAmericanApacheArabArapahoArgentineanArmenianAssyrian/Chaldean/SyriacAustralianAustrianBahamianBangladeshiBarbadianBasqueBelgianBelizeanBermudanBhutaneseBlackfeetBolivianBrazilianBritishBritish West IndianBulgarianBurmeseCajunCambodianCanadianCape VerdeanCarpatho RusynCelticCentral AmericanCentral American IndianCherokeeCheyenneChickasawChileanChineseChippewaChoctawColombianColvilleComancheCosta RicanCreeCreekCroatianCrowCubanCypriotCzechCzechoslovakianDanishDelawareDominicanDutchDutch West IndianEastern EuropeanEcuadorianEgyptianEnglishEstonianEthiopianEuropeanFijianFilipinoFinnishFrenchFrench American IndianFrench CanadianGermanGerman RussianGhanaianGreekGuamanian/ChamorroGuatemalanGuyaneseHaitianHmongHonduranHopiHoumaHungarianIcelanderIndian (Asian)IndonesianInupiatIranianIraqiIrishIroquoisIsraeliItalianJamaicanJapaneseJordanianKenyanKiowaKoreanLaotianLatvianLebaneseLiberianLithuanianLumbeeLuxembourgerMacedonianMalaysianMalteseMarshalleseMenomineeMexicanMexican American IndianMongolianMoroccanNative HawaiianNepaleseNew ZealanderNicaraguanNigerianNorthern EuropeanNorwegianOkinawanOsageOttawaPaiutePakistaniPalestinianPanamanianParaguayanPennsylvania GermanPeruvianPimaPolishPortuguesePotawatomiPuebloPuerto RicanPuget Sound SalishRomanianRussianSalvadoranSamoanScandinavianScotch-IrishScottishSeminoleSenegaleseSerbianShoshoneSierra LeoneanSiouxSlavicSlovakSloveneSomaliSouth AfricanSouth AmericanSouth American IndianSoviet UnionSpaniardSpanishSpanish AmericanSpanish American IndianSri LankanSubsaharan AfricanSudaneseSwedishSwissSyrianTaiwaneseThaiTlingit-HaidaTohono O'OdhamTonganTrinidadian and TobagonianTsimshianTurkishU.S. Virgin IslanderUgandanUkrainianUruguayanUteVenezuelanVietnameseWelshWest IndianYakamaYaquiYugoslavianYumanYup'ikZimbabwean
Immigration
NonimmigrantsImmigrantsAfghanistanAfricaAlbaniaArgentinaArmeniaAsiaAustraliaAustriaBahamasBangladeshBarbadosBelarusBelgiumBelizeBoliviaBosnia and HerzegovinaBrazilBulgariaBurma/MyanmarCabo VerdeCambodiaCameroonCanadaCaribbeanCentral AmericaChileChinaColombiaCongoCosta RicaCroatiaCubaCzechoslovakiaDenmarkDominicaDominican RepublicEastern AfricaEastern AsiaEastern EuropeEcuadorEgyptEl SalvadorEnglandEritreaEthiopiaEuropeFijiFranceGermanyGhanaGreeceGrenadaGuatemalaGuyanaHaitiHondurasHong KongHungaryIndiaIndonesiaIranIraqIrelandIsraelItalyJamaicaJapanJordanKazakhstanKenyaKoreaKuwaitLaosLatin AmericaLatviaLebanonLiberiaLithuaniaMalaysiaMexicoMicronesiaMiddle AfricaMoldovaMoroccoNepalNetherlandsNicaraguaNigeriaNorth AmericaNorth MacedoniaNorthern AfricaNorthern EuropeNorwayOceaniaPakistanPanamaPeruPhilippinesPolandPortugalRomaniaRussiaSaudi ArabiaScotlandSenegalSerbiaSierra LeoneSingaporeSomaliaSouth AfricaSouth AmericaSouth Central AsiaSouth Eastern AsiaSouthern EuropeSpainSri LankaSt. Vincent and the GrenadinesSudanSwedenSwitzerlandSyriaTaiwanThailandTrinidad and TobagoTurkeyUgandaUkraineUruguayUzbekistanVenezuelaVietnamWest IndiesWestern AfricaWestern AsiaWestern EuropeYemenZaireZimbabweAzores
Navajo
Race
Ancestry
AfghanAfricanAlaska NativeAlaskan AthabascanAlbanianAleutAlsatianAmericanApacheArabArapahoArgentineanArmenianAssyrian/Chaldean/SyriacAustralianAustrianBahamianBangladeshiBarbadianBasqueBelgianBelizeanBermudanBhutaneseBlackfeetBolivianBrazilianBritishBritish West IndianBulgarianBurmeseCajunCambodianCanadianCape VerdeanCarpatho RusynCelticCentral AmericanCentral American IndianCherokeeCheyenneChickasawChileanChineseChippewaChoctawColombianColvilleComancheCosta RicanCreeCreekCroatianCrowCubanCypriotCzechCzechoslovakianDanishDelawareDominicanDutchDutch West IndianEastern EuropeanEcuadorianEgyptianEnglishEstonianEthiopianEuropeanFijianFilipinoFinnishFrenchFrench American IndianFrench CanadianGermanGerman RussianGhanaianGreekGuamanian/ChamorroGuatemalanGuyaneseHaitianHmongHonduranHopiHoumaHungarianIcelanderIndian (Asian)IndonesianInupiatIranianIraqiIrishIroquoisIsraeliItalianJamaicanJapaneseJordanianKenyanKiowaKoreanLaotianLatvianLebaneseLiberianLithuanianLumbeeLuxembourgerMacedonianMalaysianMalteseMarshalleseMenomineeMexicanMexican American IndianMongolianMoroccanNative HawaiianNavajoNepaleseNew ZealanderNicaraguanNigerianNorthern EuropeanNorwegianOkinawanOsageOttawaPaiutePakistaniPalestinianPanamanianParaguayanPennsylvania GermanPeruvianPimaPolishPortuguesePotawatomiPuebloPuerto RicanPuget Sound SalishRomanianRussianSalvadoranSamoanScandinavianScotch-IrishScottishSeminoleSenegaleseSerbianShoshoneSierra LeoneanSiouxSlavicSlovakSloveneSomaliSouth AfricanSouth AmericanSouth American IndianSoviet UnionSpaniardSpanishSpanish AmericanSpanish American IndianSri LankanSubsaharan AfricanSudaneseSwedishSwissSyrianTaiwaneseThaiTlingit-HaidaTohono O'OdhamTonganTrinidadian and TobagonianTsimshianTurkishU.S. Virgin IslanderUgandanUkrainianUruguayanUteVenezuelanVietnameseWelshWest IndianYakamaYaquiYugoslavianYumanYup'ik
Immigration
NonimmigrantsImmigrantsAfghanistanAfricaAlbaniaArgentinaArmeniaAsiaAustraliaAustriaBahamasBangladeshBarbadosBelarusBelgiumBelizeBoliviaBosnia and HerzegovinaBrazilBulgariaBurma/MyanmarCabo VerdeCambodiaCameroonCanadaCaribbeanCentral AmericaChileChinaColombiaCongoCosta RicaCroatiaCubaCzechoslovakiaDenmarkDominicaDominican RepublicEastern AfricaEastern AsiaEastern EuropeEcuadorEgyptEl SalvadorEnglandEritreaEthiopiaEuropeFijiFranceGermanyGhanaGreeceGrenadaGuatemalaGuyanaHaitiHondurasHong KongHungaryIndiaIndonesiaIranIraqIrelandIsraelItalyJamaicaJapanJordanKazakhstanKenyaKoreaKuwaitLaosLatin AmericaLatviaLebanonLiberiaLithuaniaMalaysiaMexicoMicronesiaMiddle AfricaMoldovaMoroccoNepalNetherlandsNicaraguaNigeriaNorth AmericaNorth MacedoniaNorthern AfricaNorthern EuropeNorwayOceaniaPakistanPanamaPeruPhilippinesPolandPortugalRomaniaRussiaSaudi ArabiaScotlandSenegalSerbiaSierra LeoneSingaporeSomaliaSouth AfricaSouth AmericaSouth Central AsiaSouth Eastern AsiaSouthern EuropeSpainSri LankaSt. Vincent and the GrenadinesSudanSwedenSwitzerlandSyriaTaiwanThailandTrinidad and TobagoTurkeyUgandaUkraineUruguayUzbekistanVenezuelaVietnamWest IndiesWestern AfricaWestern AsiaWestern EuropeYemenZaireZimbabweAzores
Single Female Poverty
Income
Poverty
Unemployment
Labor Participation
Family Structure
Vehicle Availability
Education Level
Disability

Single Female Poverty Comparison

Zimbabweans

Navajo

Exceptional
Tragic
19.5%
SINGLE FEMALE POVERTY
99.0/ 100
METRIC RATING
87th/ 347
METRIC RANK
31.7%
SINGLE FEMALE POVERTY
0.0/ 100
METRIC RATING
342nd/ 347
METRIC RANK

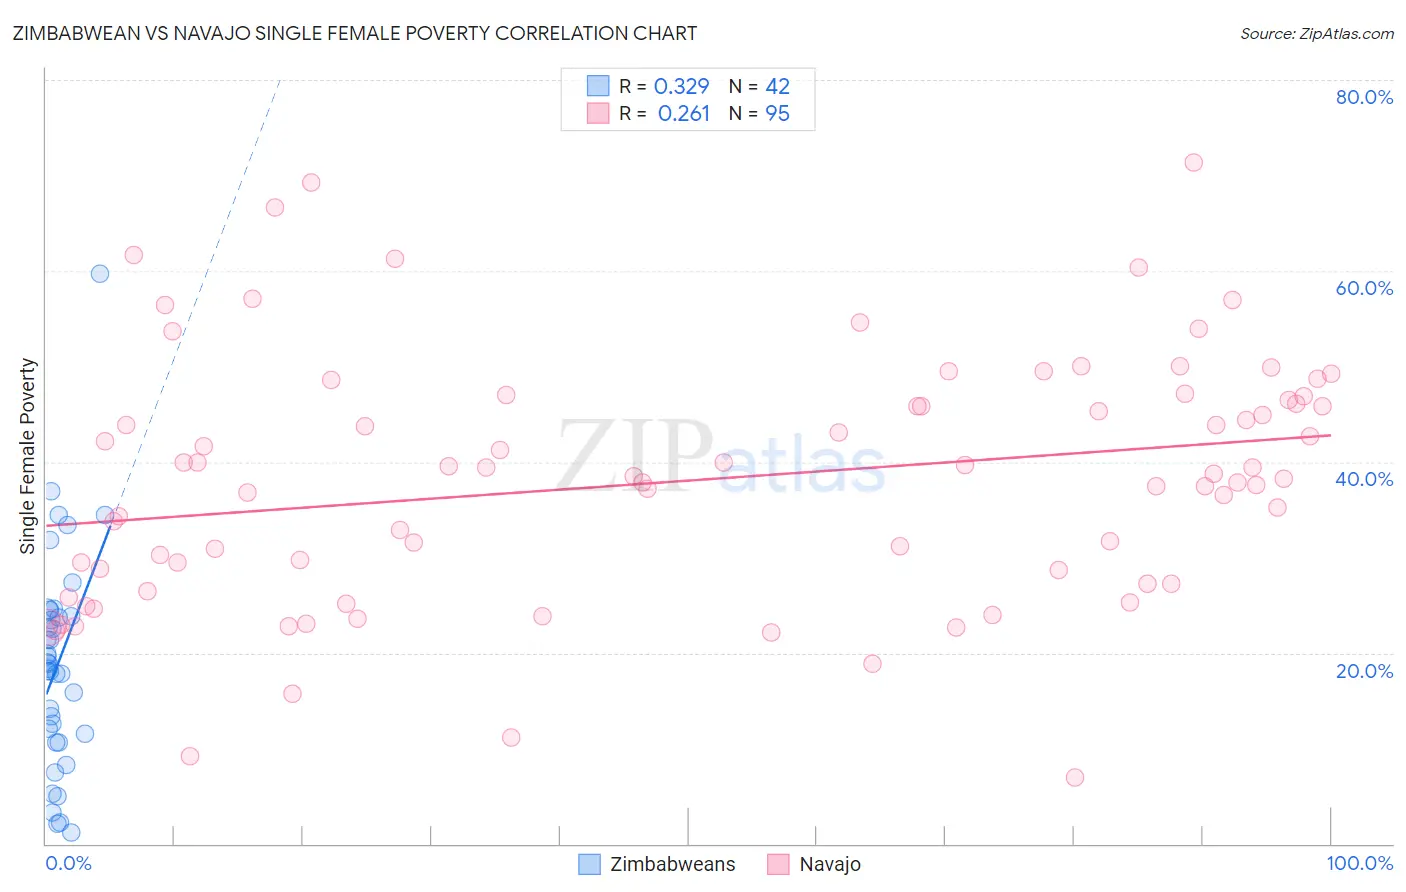
Zimbabwean vs Navajo Single Female Poverty Correlation Chart

The statistical analysis conducted on geographies consisting of 69,078,290 people shows a mild positive correlation between the proportion of Zimbabweans and poverty level among single females in the United States with a correlation coefficient (R) of 0.329 and weighted average of 19.5%. Similarly, the statistical analysis conducted on geographies consisting of 223,343,663 people shows a weak positive correlation between the proportion of Navajo and poverty level among single females in the United States with a correlation coefficient (R) of 0.261 and weighted average of 31.7%, a difference of 62.2%.
Zimbabwean vs Navajo Single Female Poverty

Single Female Poverty Correlation Summary

MeasurementZimbabweanNavajo
Minimum1.1%7.0%
Maximum59.7%71.4%
Range58.6%64.4%
Mean18.9%38.1%
Median18.6%38.5%
Interquartile 25% (IQ1)11.6%27.3%
Interquartile 75% (IQ3)23.8%46.5%
Interquartile Range (IQR)12.2%19.3%
Standard Deviation (Sample)11.3%13.1%
Standard Deviation (Population)11.1%13.0%

Similar Demographics by Single Female Poverty

Demographics Similar to Zimbabweans by Single Female Poverty

In terms of single female poverty, the demographic groups most similar to Zimbabweans are Afghan (19.5%, a difference of 0.020%), Immigrants from Ukraine (19.5%, a difference of 0.030%), Immigrants from Lebanon (19.6%, a difference of 0.20%), Soviet Union (19.6%, a difference of 0.27%), and Italian (19.6%, a difference of 0.31%).
DemographicsRating | RankSingle Female Poverty
Immigrants | Australia
99.3
/100
|
#80
Exceptional
19.4%
Immigrants | Scotland
99.2
/100
|
#81
Exceptional
19.4%
Immigrants | Malaysia
99.2
/100
|
#82
Exceptional
19.4%
Taiwanese
99.2
/100
|
#83
Exceptional
19.4%
Immigrants | Sweden
99.2
/100
|
#84
Exceptional
19.4%
Immigrants | Albania
99.2
/100
|
#85
Exceptional
19.4%
Greeks
99.2
/100
|
#86
Exceptional
19.4%
Zimbabweans
99.0
/100
|
#87
Exceptional
19.5%
Afghans
99.0
/100
|
#88
Exceptional
19.5%
Immigrants | Ukraine
99.0
/100
|
#89
Exceptional
19.5%
Immigrants | Lebanon
98.8
/100
|
#90
Exceptional
19.6%
Soviet Union
98.8
/100
|
#91
Exceptional
19.6%
Italians
98.8
/100
|
#92
Exceptional
19.6%
Immigrants | Austria
98.8
/100
|
#93
Exceptional
19.6%
Romanians
98.6
/100
|
#94
Exceptional
19.6%

Demographics Similar to Navajo by Single Female Poverty

In terms of single female poverty, the demographic groups most similar to Navajo are Sioux (31.3%, a difference of 1.3%), Crow (32.4%, a difference of 2.4%), Cajun (30.6%, a difference of 3.3%), Cheyenne (30.4%, a difference of 4.1%), and Lumbee (33.0%, a difference of 4.3%).
DemographicsRating | RankSingle Female Poverty
Ute
0.0
/100
|
#333
Tragic
28.4%
Pueblo
0.0
/100
|
#334
Tragic
28.6%
Immigrants | Yemen
0.0
/100
|
#335
Tragic
28.9%
Colville
0.0
/100
|
#336
Tragic
29.1%
Yuman
0.0
/100
|
#337
Tragic
29.4%
Pima
0.0
/100
|
#338
Tragic
30.3%
Cheyenne
0.0
/100
|
#339
Tragic
30.4%
Cajuns
0.0
/100
|
#340
Tragic
30.6%
Sioux
0.0
/100
|
#341
Tragic
31.3%
Navajo
0.0
/100
|
#342
Tragic
31.7%
Crow
0.0
/100
|
#343
Tragic
32.4%
Lumbee
0.0
/100
|
#344
Tragic
33.0%
Houma
0.0
/100
|
#345
Tragic
33.8%
Puerto Ricans
0.0
/100
|
#346
Tragic
34.1%
Tohono O'odham
0.0
/100
|
#347
Tragic
34.2%