Thai vs Soviet Union Receiving Food Stamps

COMPARE

Thai
Race
Ancestry
AfghanAfricanAlaska NativeAlaskan AthabascanAlbanianAleutAlsatianAmericanApacheArabArapahoArgentineanArmenianAssyrian/Chaldean/SyriacAustralianAustrianBahamianBangladeshiBarbadianBasqueBelgianBelizeanBermudanBhutaneseBlackfeetBolivianBrazilianBritishBritish West IndianBulgarianBurmeseCajunCambodianCanadianCape VerdeanCarpatho RusynCelticCentral AmericanCentral American IndianCherokeeCheyenneChickasawChileanChineseChippewaChoctawColombianColvilleComancheCosta RicanCreeCreekCroatianCrowCubanCypriotCzechCzechoslovakianDanishDelawareDominicanDutchDutch West IndianEastern EuropeanEcuadorianEgyptianEnglishEstonianEthiopianEuropeanFijianFilipinoFinnishFrenchFrench American IndianFrench CanadianGermanGerman RussianGhanaianGreekGuamanian/ChamorroGuatemalanGuyaneseHaitianHmongHonduranHopiHoumaHungarianIcelanderIndian (Asian)IndonesianInupiatIranianIraqiIrishIroquoisIsraeliItalianJamaicanJapaneseJordanianKenyanKiowaKoreanLaotianLatvianLebaneseLiberianLithuanianLumbeeLuxembourgerMacedonianMalaysianMalteseMarshalleseMenomineeMexicanMexican American IndianMongolianMoroccanNative HawaiianNavajoNepaleseNew ZealanderNicaraguanNigerianNorthern EuropeanNorwegianOkinawanOsageOttawaPaiutePakistaniPalestinianPanamanianParaguayanPennsylvania GermanPeruvianPimaPolishPortuguesePotawatomiPuebloPuerto RicanPuget Sound SalishRomanianRussianSalvadoranSamoanScandinavianScotch-IrishScottishSeminoleSenegaleseSerbianShoshoneSierra LeoneanSiouxSlavicSlovakSloveneSomaliSouth AfricanSouth AmericanSouth American IndianSpaniardSpanishSpanish AmericanSpanish American IndianSri LankanSubsaharan AfricanSudaneseSwedishSwissSyrianTaiwaneseThaiTlingit-HaidaTohono O'OdhamTonganTrinidadian and TobagonianTsimshianTurkishU.S. Virgin IslanderUgandanUkrainianUruguayanUteVenezuelanVietnameseWelshWest IndianYakamaYaquiYugoslavianYumanYup'ikZimbabwean
Immigration
NonimmigrantsImmigrantsAfghanistanAfricaAlbaniaArgentinaArmeniaAsiaAustraliaAustriaBahamasBangladeshBarbadosBelarusBelgiumBelizeBoliviaBosnia and HerzegovinaBrazilBulgariaBurma/MyanmarCabo VerdeCambodiaCameroonCanadaCaribbeanCentral AmericaChileChinaColombiaCongoCosta RicaCroatiaCubaCzechoslovakiaDenmarkDominicaDominican RepublicEastern AfricaEastern AsiaEastern EuropeEcuadorEgyptEl SalvadorEnglandEritreaEthiopiaEuropeFijiFranceGermanyGhanaGreeceGrenadaGuatemalaGuyanaHaitiHondurasHong KongHungaryIndiaIndonesiaIranIraqIrelandIsraelItalyJamaicaJapanJordanKazakhstanKenyaKoreaKuwaitLaosLatin AmericaLatviaLebanonLiberiaLithuaniaMalaysiaMexicoMicronesiaMiddle AfricaMoldovaMoroccoNepalNetherlandsNicaraguaNigeriaNorth AmericaNorth MacedoniaNorthern AfricaNorthern EuropeNorwayOceaniaPakistanPanamaPeruPhilippinesPolandPortugalRomaniaRussiaSaudi ArabiaScotlandSenegalSerbiaSierra LeoneSingaporeSomaliaSouth AfricaSouth AmericaSouth Central AsiaSouth Eastern AsiaSouthern EuropeSpainSri LankaSt. Vincent and the GrenadinesSudanSwedenSwitzerlandSyriaTaiwanThailandTrinidad and TobagoTurkeyUgandaUkraineUruguayUzbekistanVenezuelaVietnamWest IndiesWestern AfricaWestern AsiaWestern EuropeYemenZaireZimbabweAzores
Soviet Union
Race
Ancestry
AfghanAfricanAlaska NativeAlaskan AthabascanAlbanianAleutAlsatianAmericanApacheArabArapahoArgentineanArmenianAssyrian/Chaldean/SyriacAustralianAustrianBahamianBangladeshiBarbadianBasqueBelgianBelizeanBermudanBhutaneseBlackfeetBolivianBrazilianBritishBritish West IndianBulgarianBurmeseCajunCambodianCanadianCape VerdeanCarpatho RusynCelticCentral AmericanCentral American IndianCherokeeCheyenneChickasawChileanChineseChippewaChoctawColombianColvilleComancheCosta RicanCreeCreekCroatianCrowCubanCypriotCzechCzechoslovakianDanishDelawareDominicanDutchDutch West IndianEastern EuropeanEcuadorianEgyptianEnglishEstonianEthiopianEuropeanFijianFilipinoFinnishFrenchFrench American IndianFrench CanadianGermanGerman RussianGhanaianGreekGuamanian/ChamorroGuatemalanGuyaneseHaitianHmongHonduranHopiHoumaHungarianIcelanderIndian (Asian)IndonesianInupiatIranianIraqiIrishIroquoisIsraeliItalianJamaicanJapaneseJordanianKenyanKiowaKoreanLaotianLatvianLebaneseLiberianLithuanianLumbeeLuxembourgerMacedonianMalaysianMalteseMarshalleseMenomineeMexicanMexican American IndianMongolianMoroccanNative HawaiianNavajoNepaleseNew ZealanderNicaraguanNigerianNorthern EuropeanNorwegianOkinawanOsageOttawaPaiutePakistaniPalestinianPanamanianParaguayanPennsylvania GermanPeruvianPimaPolishPortuguesePotawatomiPuebloPuerto RicanPuget Sound SalishRomanianRussianSalvadoranSamoanScandinavianScotch-IrishScottishSeminoleSenegaleseSerbianShoshoneSierra LeoneanSiouxSlavicSlovakSloveneSomaliSouth AfricanSouth AmericanSouth American IndianSoviet UnionSpaniardSpanishSpanish AmericanSpanish American IndianSri LankanSubsaharan AfricanSudaneseSwedishSwissSyrianTaiwaneseTlingit-HaidaTohono O'OdhamTonganTrinidadian and TobagonianTsimshianTurkishU.S. Virgin IslanderUgandanUkrainianUruguayanUteVenezuelanVietnameseWelshWest IndianYakamaYaquiYugoslavianYumanYup'ikZimbabwean
Immigration
NonimmigrantsImmigrantsAfghanistanAfricaAlbaniaArgentinaArmeniaAsiaAustraliaAustriaBahamasBangladeshBarbadosBelarusBelgiumBelizeBoliviaBosnia and HerzegovinaBrazilBulgariaBurma/MyanmarCabo VerdeCambodiaCameroonCanadaCaribbeanCentral AmericaChileChinaColombiaCongoCosta RicaCroatiaCubaCzechoslovakiaDenmarkDominicaDominican RepublicEastern AfricaEastern AsiaEastern EuropeEcuadorEgyptEl SalvadorEnglandEritreaEthiopiaEuropeFijiFranceGermanyGhanaGreeceGrenadaGuatemalaGuyanaHaitiHondurasHong KongHungaryIndiaIndonesiaIranIraqIrelandIsraelItalyJamaicaJapanJordanKazakhstanKenyaKoreaKuwaitLaosLatin AmericaLatviaLebanonLiberiaLithuaniaMalaysiaMexicoMicronesiaMiddle AfricaMoldovaMoroccoNepalNetherlandsNicaraguaNigeriaNorth AmericaNorth MacedoniaNorthern AfricaNorthern EuropeNorwayOceaniaPakistanPanamaPeruPhilippinesPolandPortugalRomaniaRussiaSaudi ArabiaScotlandSenegalSerbiaSierra LeoneSingaporeSomaliaSouth AfricaSouth AmericaSouth Central AsiaSouth Eastern AsiaSouthern EuropeSpainSri LankaSt. Vincent and the GrenadinesSudanSwedenSwitzerlandSyriaTaiwanThailandTrinidad and TobagoTurkeyUgandaUkraineUruguayUzbekistanVenezuelaVietnamWest IndiesWestern AfricaWestern AsiaWestern EuropeYemenZaireZimbabweAzores
Receiving Food Stamps
Income
Poverty
Unemployment
Labor Participation
Family Structure
Vehicle Availability
Education Level
Disability

Receiving Food Stamps Comparison

Thais

Soviet Union

Exceptional
Excellent
8.1%
RECEIVING FOOD STAMPS
100.0/ 100
METRIC RATING
5th/ 347
METRIC RANK
11.1%
RECEIVING FOOD STAMPS
83.1/ 100
METRIC RATING
150th/ 347
METRIC RANK

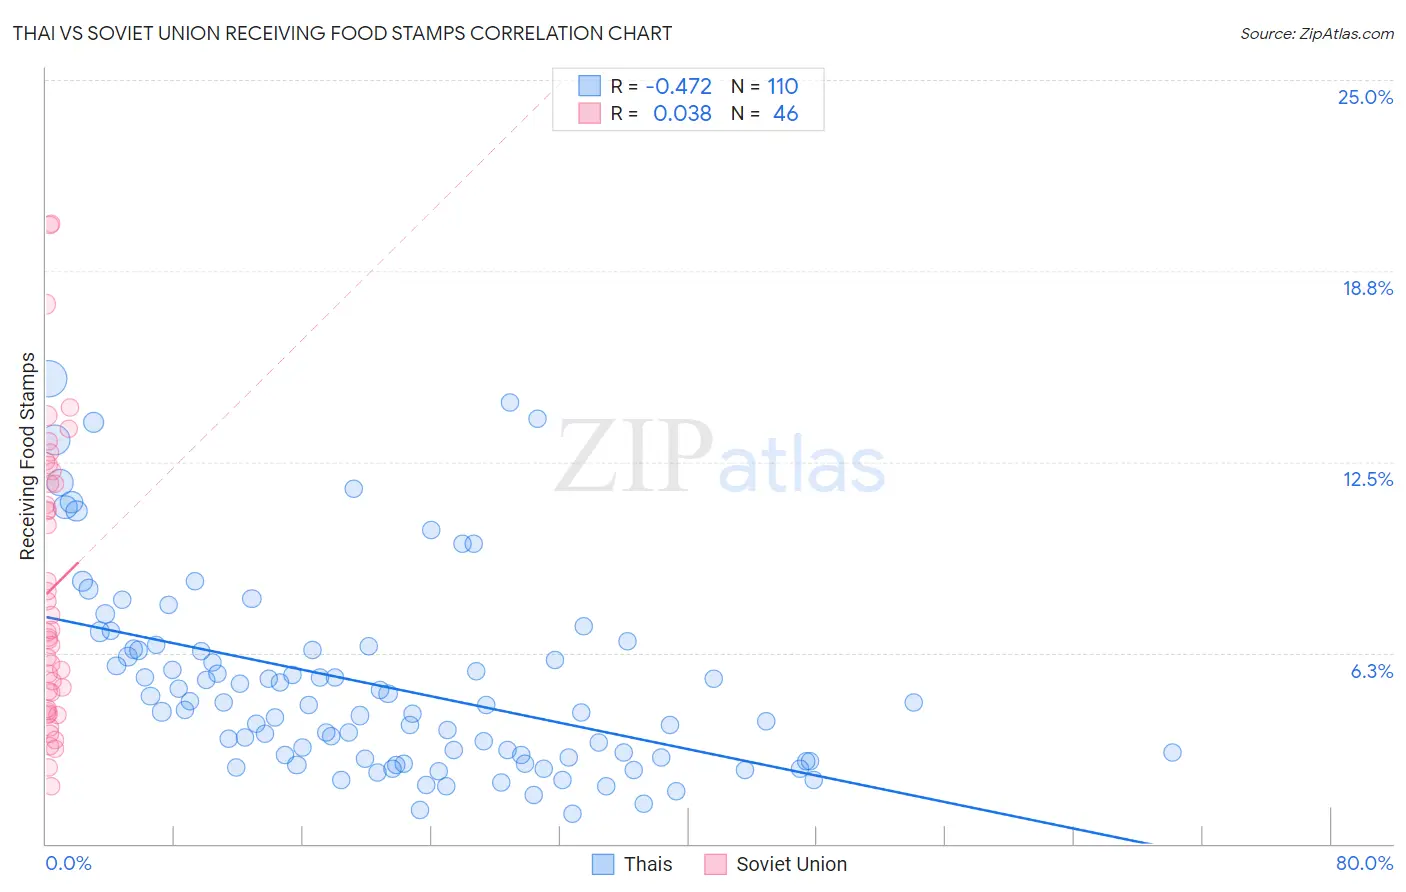
Thai vs Soviet Union Receiving Food Stamps Correlation Chart

The statistical analysis conducted on geographies consisting of 473,754,114 people shows a moderate negative correlation between the proportion of Thais and percentage of population receiving government assistance and/or food stamps in the United States with a correlation coefficient (R) of -0.472 and weighted average of 8.1%. Similarly, the statistical analysis conducted on geographies consisting of 43,471,584 people shows no correlation between the proportion of Soviet Union and percentage of population receiving government assistance and/or food stamps in the United States with a correlation coefficient (R) of 0.038 and weighted average of 11.1%, a difference of 36.6%.
Thai vs Soviet Union Receiving Food Stamps

Receiving Food Stamps Correlation Summary

MeasurementThaiSoviet Union
Minimum1.0%1.9%
Maximum15.2%20.3%
Range14.2%18.4%
Mean5.2%8.3%
Median4.4%6.8%
Interquartile 25% (IQ1)2.8%4.4%
Interquartile 75% (IQ3)6.3%11.8%
Interquartile Range (IQR)3.5%7.4%
Standard Deviation (Sample)3.1%4.6%
Standard Deviation (Population)3.1%4.6%

Similar Demographics by Receiving Food Stamps

Demographics Similar to Thais by Receiving Food Stamps

In terms of receiving food stamps, the demographic groups most similar to Thais are Iranian (7.9%, a difference of 2.3%), Immigrants from Singapore (8.3%, a difference of 2.3%), Immigrants from Iran (8.3%, a difference of 2.9%), Burmese (8.6%, a difference of 6.6%), and Immigrants from Korea (8.7%, a difference of 6.8%).
DemographicsRating | RankReceiving Food Stamps
Immigrants | Taiwan
100.0
/100
|
#1
Exceptional
7.3%
Immigrants | India
100.0
/100
|
#2
Exceptional
7.4%
Filipinos
100.0
/100
|
#3
Exceptional
7.4%
Iranians
100.0
/100
|
#4
Exceptional
7.9%
Thais
100.0
/100
|
#5
Exceptional
8.1%
Immigrants | Singapore
100.0
/100
|
#6
Exceptional
8.3%
Immigrants | Iran
100.0
/100
|
#7
Exceptional
8.3%
Burmese
99.9
/100
|
#8
Exceptional
8.6%
Immigrants | Korea
99.9
/100
|
#9
Exceptional
8.7%
Immigrants | South Central Asia
99.9
/100
|
#10
Exceptional
8.8%
Okinawans
99.9
/100
|
#11
Exceptional
8.9%
Cypriots
99.9
/100
|
#12
Exceptional
8.9%
Bulgarians
99.9
/100
|
#13
Exceptional
8.9%
Maltese
99.9
/100
|
#14
Exceptional
8.9%
Norwegians
99.9
/100
|
#15
Exceptional
9.0%

Demographics Similar to Soviet Union by Receiving Food Stamps

In terms of receiving food stamps, the demographic groups most similar to Soviet Union are Brazilian (11.1%, a difference of 0.020%), Immigrants from South Eastern Asia (11.1%, a difference of 0.040%), White/Caucasian (11.1%, a difference of 0.21%), Taiwanese (11.0%, a difference of 0.30%), and Immigrants from Spain (11.1%, a difference of 0.36%).
DemographicsRating | RankReceiving Food Stamps
Immigrants | Northern Africa
86.0
/100
|
#143
Excellent
11.0%
Syrians
85.5
/100
|
#144
Excellent
11.0%
Hungarians
85.1
/100
|
#145
Excellent
11.0%
Taiwanese
84.2
/100
|
#146
Excellent
11.0%
Whites/Caucasians
83.9
/100
|
#147
Excellent
11.1%
Immigrants | South Eastern Asia
83.3
/100
|
#148
Excellent
11.1%
Brazilians
83.2
/100
|
#149
Excellent
11.1%
Soviet Union
83.1
/100
|
#150
Excellent
11.1%
Immigrants | Spain
81.7
/100
|
#151
Excellent
11.1%
Immigrants | Kazakhstan
81.7
/100
|
#152
Excellent
11.1%
Lebanese
81.6
/100
|
#153
Excellent
11.1%
Armenians
81.4
/100
|
#154
Excellent
11.1%
Immigrants | Argentina
80.4
/100
|
#155
Excellent
11.2%
Immigrants | Afghanistan
75.6
/100
|
#156
Good
11.3%
Immigrants | Lebanon
75.2
/100
|
#157
Good
11.3%