Subsaharan African vs Senegalese Family Households
COMPARE
Subsaharan African
Senegalese
Family Households
Family Households Comparison
Sub-Saharan Africans
Senegalese
62.1%
FAMILY HOUSEHOLDS
0.0/ 100
METRIC RATING
309th/ 347
METRIC RANK
59.8%
FAMILY HOUSEHOLDS
0.0/ 100
METRIC RATING
343rd/ 347
METRIC RANK
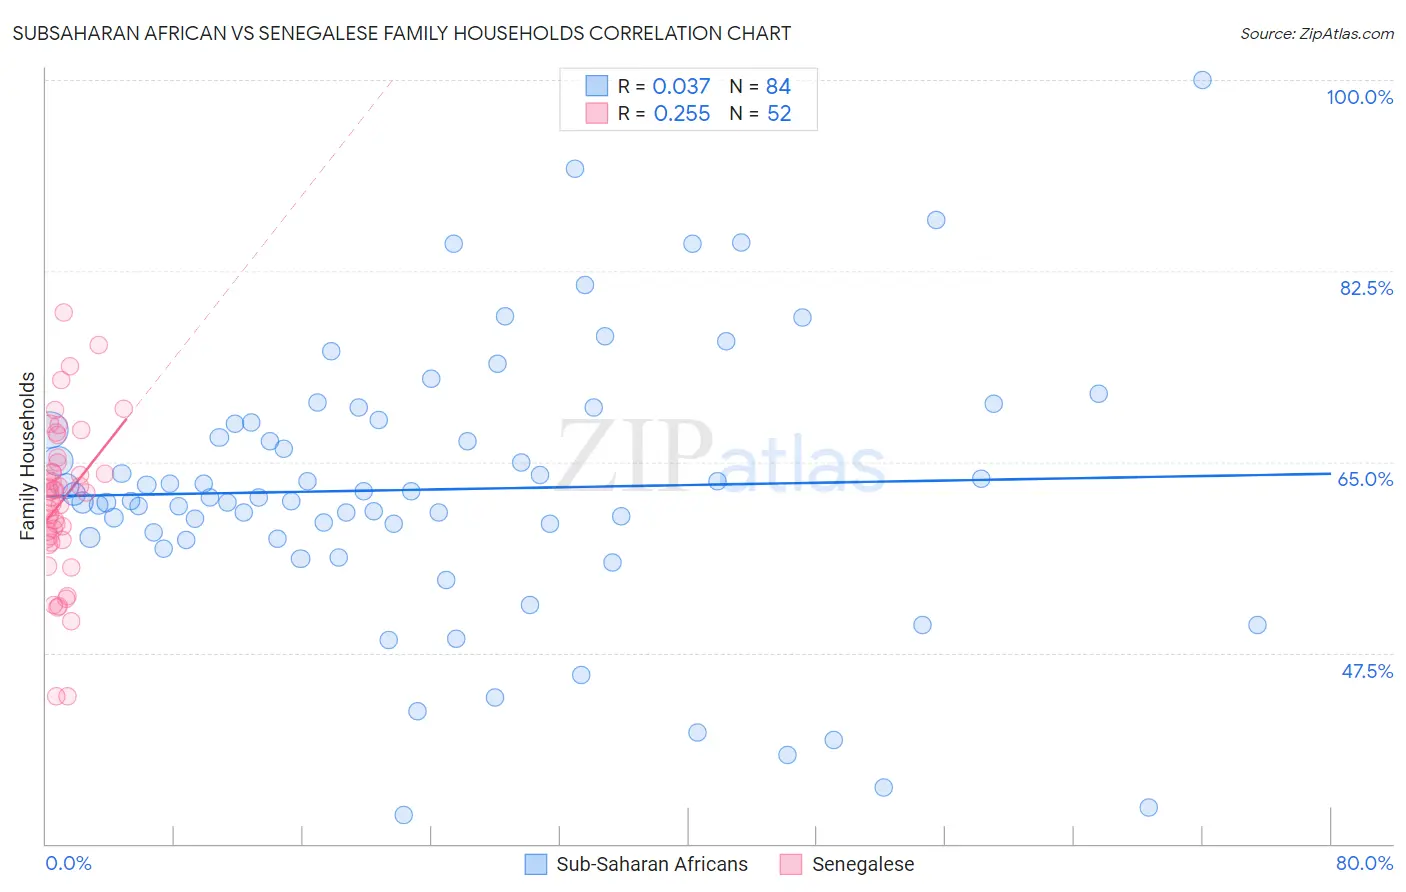
Subsaharan African vs Senegalese Family Households Correlation Chart
The statistical analysis conducted on geographies consisting of 507,604,715 people shows no correlation between the proportion of Sub-Saharan Africans and percentage of family households in the United States with a correlation coefficient (R) of 0.037 and weighted average of 62.1%. Similarly, the statistical analysis conducted on geographies consisting of 78,113,781 people shows a weak positive correlation between the proportion of Senegalese and percentage of family households in the United States with a correlation coefficient (R) of 0.255 and weighted average of 59.8%, a difference of 3.7%.
Family Households Correlation Summary
| Measurement | Subsaharan African | Senegalese |
| Minimum | 32.6% | 43.5% |
| Maximum | 100.0% | 78.7% |
| Range | 67.4% | 35.1% |
| Mean | 62.5% | 61.3% |
| Median | 61.7% | 61.9% |
| Interquartile 25% (IQ1) | 58.0% | 58.0% |
| Interquartile 75% (IQ3) | 68.6% | 64.5% |
| Interquartile Range (IQR) | 10.5% | 6.5% |
| Standard Deviation (Sample) | 12.5% | 7.1% |
| Standard Deviation (Population) | 12.4% | 7.0% |
Similar Demographics by Family Households
Demographics Similar to Sub-Saharan Africans by Family Households
In terms of family households, the demographic groups most similar to Sub-Saharan Africans are Immigrants from Liberia (62.0%, a difference of 0.040%), Immigrants from Norway (62.1%, a difference of 0.050%), Chippewa (62.1%, a difference of 0.050%), Immigrants from Morocco (62.0%, a difference of 0.070%), and Immigrants from Latvia (62.0%, a difference of 0.12%).
| Demographics | Rating | Rank | Family Households |
| Immigrants | Kenya | 0.0 /100 | #302 | Tragic 62.3% |
| Cree | 0.0 /100 | #303 | Tragic 62.3% |
| Iroquois | 0.0 /100 | #304 | Tragic 62.2% |
| Bermudans | 0.0 /100 | #305 | Tragic 62.2% |
| Africans | 0.0 /100 | #306 | Tragic 62.1% |
| Immigrants | Norway | 0.0 /100 | #307 | Tragic 62.1% |
| Chippewa | 0.0 /100 | #308 | Tragic 62.1% |
| Sub-Saharan Africans | 0.0 /100 | #309 | Tragic 62.1% |
| Immigrants | Liberia | 0.0 /100 | #310 | Tragic 62.0% |
| Immigrants | Morocco | 0.0 /100 | #311 | Tragic 62.0% |
| Immigrants | Latvia | 0.0 /100 | #312 | Tragic 62.0% |
| Liberians | 0.0 /100 | #313 | Tragic 62.0% |
| Immigrants | Cabo Verde | 0.0 /100 | #314 | Tragic 61.9% |
| Moroccans | 0.0 /100 | #315 | Tragic 61.9% |
| Immigrants | Middle Africa | 0.0 /100 | #316 | Tragic 61.9% |
Demographics Similar to Senegalese by Family Households
In terms of family households, the demographic groups most similar to Senegalese are Sudanese (60.0%, a difference of 0.30%), Immigrants from Senegal (60.1%, a difference of 0.48%), Immigrants from Sudan (60.2%, a difference of 0.57%), Immigrants from Congo (59.2%, a difference of 0.97%), and Immigrants from Zaire (59.2%, a difference of 1.1%).
| Demographics | Rating | Rank | Family Households |
| Immigrants | Ethiopia | 0.0 /100 | #333 | Tragic 61.2% |
| Immigrants | Eastern Africa | 0.0 /100 | #334 | Tragic 61.1% |
| Carpatho Rusyns | 0.0 /100 | #335 | Tragic 61.1% |
| German Russians | 0.0 /100 | #336 | Tragic 60.9% |
| Soviet Union | 0.0 /100 | #337 | Tragic 60.9% |
| Immigrants | Eritrea | 0.0 /100 | #338 | Tragic 60.8% |
| Immigrants | Saudi Arabia | 0.0 /100 | #339 | Tragic 60.7% |
| Immigrants | Sudan | 0.0 /100 | #340 | Tragic 60.2% |
| Immigrants | Senegal | 0.0 /100 | #341 | Tragic 60.1% |
| Sudanese | 0.0 /100 | #342 | Tragic 60.0% |
| Senegalese | 0.0 /100 | #343 | Tragic 59.8% |
| Immigrants | Congo | 0.0 /100 | #344 | Tragic 59.2% |
| Immigrants | Zaire | 0.0 /100 | #345 | Tragic 59.2% |
| Somalis | 0.0 /100 | #346 | Tragic 57.6% |
| Immigrants | Somalia | 0.0 /100 | #347 | Tragic 56.7% |