Sri Lankan vs Zimbabwean Receiving Food Stamps
COMPARE
Sri Lankan
Zimbabwean
Receiving Food Stamps
Receiving Food Stamps Comparison
Sri Lankans
Zimbabweans
10.6%
RECEIVING FOOD STAMPS
93.7/ 100
METRIC RATING
122nd/ 347
METRIC RANK
9.5%
RECEIVING FOOD STAMPS
99.6/ 100
METRIC RATING
33rd/ 347
METRIC RANK
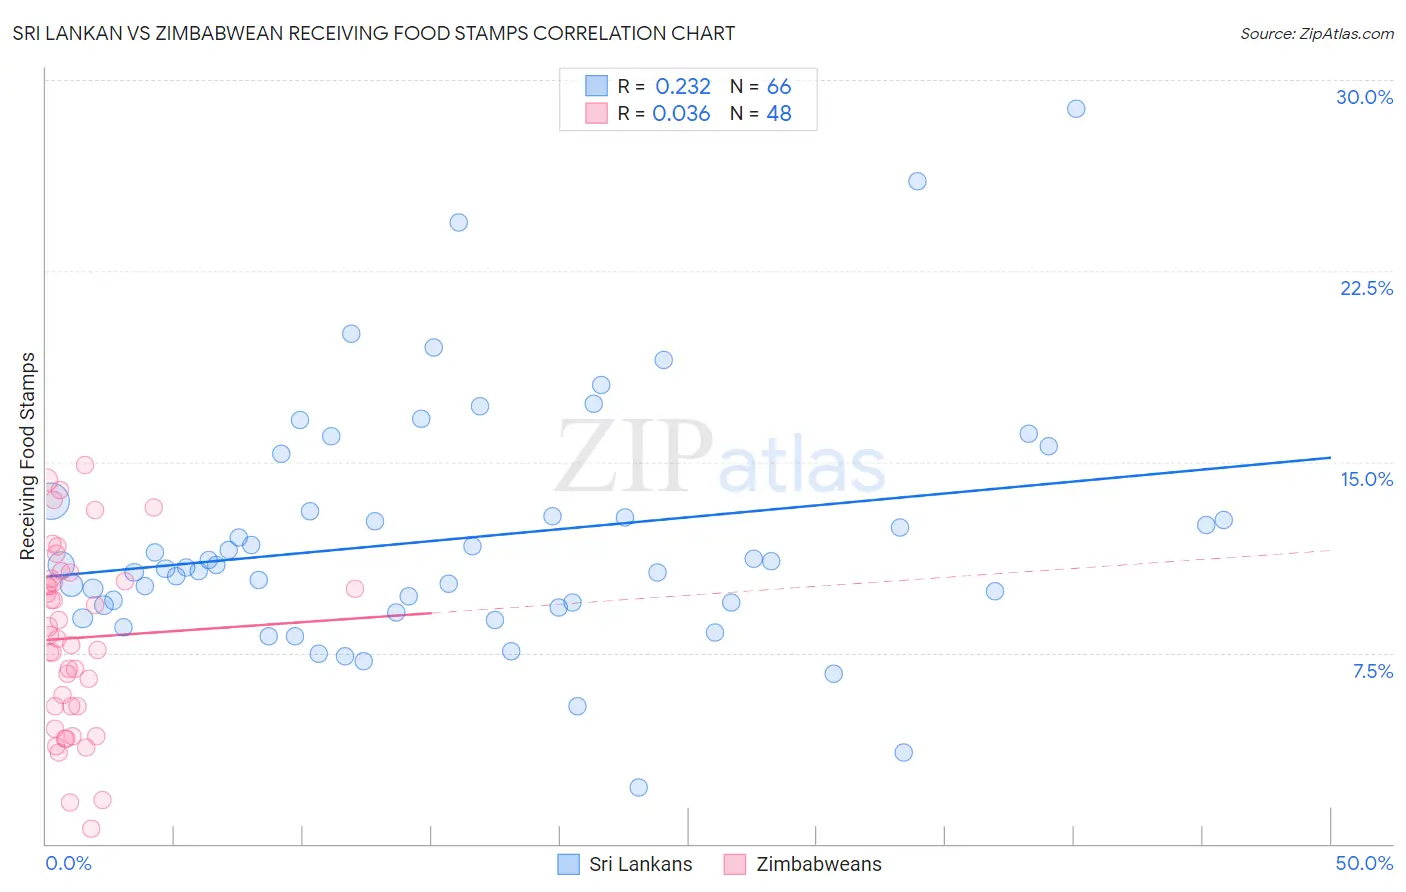
Sri Lankan vs Zimbabwean Receiving Food Stamps Correlation Chart
The statistical analysis conducted on geographies consisting of 439,146,185 people shows a weak positive correlation between the proportion of Sri Lankans and percentage of population receiving government assistance and/or food stamps in the United States with a correlation coefficient (R) of 0.232 and weighted average of 10.6%. Similarly, the statistical analysis conducted on geographies consisting of 69,180,670 people shows no correlation between the proportion of Zimbabweans and percentage of population receiving government assistance and/or food stamps in the United States with a correlation coefficient (R) of 0.036 and weighted average of 9.5%, a difference of 12.1%.
Receiving Food Stamps Correlation Summary
| Measurement | Sri Lankan | Zimbabwean |
| Minimum | 2.2% | 0.60% |
| Maximum | 28.8% | 14.9% |
| Range | 26.6% | 14.3% |
| Mean | 12.0% | 8.1% |
| Median | 10.9% | 8.1% |
| Interquartile 25% (IQ1) | 9.4% | 5.4% |
| Interquartile 75% (IQ3) | 13.1% | 10.4% |
| Interquartile Range (IQR) | 3.7% | 5.0% |
| Standard Deviation (Sample) | 4.8% | 3.6% |
| Standard Deviation (Population) | 4.7% | 3.5% |
Similar Demographics by Receiving Food Stamps
Demographics Similar to Sri Lankans by Receiving Food Stamps
In terms of receiving food stamps, the demographic groups most similar to Sri Lankans are Slavic (10.6%, a difference of 0.070%), Immigrants from Poland (10.6%, a difference of 0.11%), Ethiopian (10.6%, a difference of 0.11%), Immigrants from Philippines (10.7%, a difference of 0.25%), and Assyrian/Chaldean/Syriac (10.6%, a difference of 0.27%).
| Demographics | Rating | Rank | Receiving Food Stamps |
| Immigrants | Saudi Arabia | 94.9 /100 | #115 | Exceptional 10.5% |
| Canadians | 94.8 /100 | #116 | Exceptional 10.5% |
| Immigrants | Nepal | 94.6 /100 | #117 | Exceptional 10.6% |
| Assyrians/Chaldeans/Syriacs | 94.1 /100 | #118 | Exceptional 10.6% |
| Immigrants | Poland | 93.9 /100 | #119 | Exceptional 10.6% |
| Ethiopians | 93.9 /100 | #120 | Exceptional 10.6% |
| Slavs | 93.8 /100 | #121 | Exceptional 10.6% |
| Sri Lankans | 93.7 /100 | #122 | Exceptional 10.6% |
| Immigrants | Philippines | 93.3 /100 | #123 | Exceptional 10.7% |
| Paraguayans | 93.0 /100 | #124 | Exceptional 10.7% |
| Ukrainians | 92.8 /100 | #125 | Exceptional 10.7% |
| Afghans | 92.6 /100 | #126 | Exceptional 10.7% |
| Immigrants | Ethiopia | 92.6 /100 | #127 | Exceptional 10.7% |
| Immigrants | Jordan | 92.5 /100 | #128 | Exceptional 10.7% |
| Yugoslavians | 92.5 /100 | #129 | Exceptional 10.7% |
Demographics Similar to Zimbabweans by Receiving Food Stamps
In terms of receiving food stamps, the demographic groups most similar to Zimbabweans are Turkish (9.5%, a difference of 0.010%), Immigrants from Austria (9.5%, a difference of 0.050%), Estonian (9.5%, a difference of 0.070%), European (9.5%, a difference of 0.13%), and Immigrants from Sri Lanka (9.5%, a difference of 0.42%).
| Demographics | Rating | Rank | Receiving Food Stamps |
| Swedes | 99.8 /100 | #26 | Exceptional 9.2% |
| Bhutanese | 99.8 /100 | #27 | Exceptional 9.2% |
| Czechs | 99.8 /100 | #28 | Exceptional 9.2% |
| Immigrants | Lithuania | 99.8 /100 | #29 | Exceptional 9.2% |
| Immigrants | Sweden | 99.7 /100 | #30 | Exceptional 9.3% |
| Immigrants | Eastern Asia | 99.7 /100 | #31 | Exceptional 9.3% |
| Bolivians | 99.7 /100 | #32 | Exceptional 9.3% |
| Zimbabweans | 99.6 /100 | #33 | Exceptional 9.5% |
| Turks | 99.6 /100 | #34 | Exceptional 9.5% |
| Immigrants | Austria | 99.6 /100 | #35 | Exceptional 9.5% |
| Estonians | 99.6 /100 | #36 | Exceptional 9.5% |
| Europeans | 99.6 /100 | #37 | Exceptional 9.5% |
| Immigrants | Sri Lanka | 99.5 /100 | #38 | Exceptional 9.5% |
| Immigrants | Bolivia | 99.5 /100 | #39 | Exceptional 9.5% |
| Immigrants | Netherlands | 99.5 /100 | #40 | Exceptional 9.5% |