Pima vs Immigrants from Korea Single Father Poverty

COMPARE

Pima
Race
Ancestry
AfghanAfricanAlaska NativeAlaskan AthabascanAlbanianAleutAlsatianAmericanApacheArabArapahoArgentineanArmenianAssyrian/Chaldean/SyriacAustralianAustrianBahamianBangladeshiBarbadianBasqueBelgianBelizeanBermudanBhutaneseBlackfeetBolivianBrazilianBritishBritish West IndianBulgarianBurmeseCajunCambodianCanadianCape VerdeanCarpatho RusynCelticCentral AmericanCentral American IndianCherokeeCheyenneChickasawChileanChineseChippewaChoctawColombianColvilleComancheCosta RicanCreeCreekCroatianCrowCubanCypriotCzechCzechoslovakianDanishDelawareDominicanDutchDutch West IndianEastern EuropeanEcuadorianEgyptianEnglishEstonianEthiopianEuropeanFijianFilipinoFinnishFrenchFrench American IndianFrench CanadianGermanGerman RussianGhanaianGreekGuamanian/ChamorroGuatemalanGuyaneseHaitianHmongHonduranHopiHoumaHungarianIcelanderIndian (Asian)IndonesianInupiatIranianIraqiIrishIroquoisIsraeliItalianJamaicanJapaneseJordanianKenyanKiowaKoreanLaotianLatvianLebaneseLiberianLithuanianLumbeeLuxembourgerMacedonianMalaysianMalteseMarshalleseMenomineeMexicanMexican American IndianMongolianMoroccanNative HawaiianNavajoNepaleseNew ZealanderNicaraguanNigerianNorthern EuropeanNorwegianOkinawanOsageOttawaPaiutePakistaniPalestinianPanamanianParaguayanPennsylvania GermanPeruvianPimaPolishPortuguesePotawatomiPuebloPuerto RicanPuget Sound SalishRomanianRussianSalvadoranSamoanScandinavianScotch-IrishScottishSeminoleSenegaleseSerbianShoshoneSierra LeoneanSiouxSlavicSlovakSloveneSomaliSouth AfricanSouth AmericanSouth American IndianSoviet UnionSpaniardSpanishSpanish AmericanSpanish American IndianSri LankanSubsaharan AfricanSudaneseSwedishSwissSyrianTaiwaneseThaiTlingit-HaidaTohono O'OdhamTonganTrinidadian and TobagonianTsimshianTurkishU.S. Virgin IslanderUgandanUkrainianUruguayanUteVenezuelanVietnameseWelshWest IndianYakamaYaquiYugoslavianYumanYup'ikZimbabwean
Immigration
NonimmigrantsImmigrantsAfghanistanAfricaAlbaniaArgentinaArmeniaAsiaAustraliaAustriaBahamasBangladeshBarbadosBelarusBelgiumBelizeBoliviaBosnia and HerzegovinaBrazilBulgariaBurma/MyanmarCabo VerdeCambodiaCameroonCanadaCaribbeanCentral AmericaChileChinaColombiaCongoCosta RicaCroatiaCubaCzechoslovakiaDenmarkDominicaDominican RepublicEastern AfricaEastern AsiaEastern EuropeEcuadorEgyptEl SalvadorEnglandEritreaEthiopiaEuropeFijiFranceGermanyGhanaGreeceGrenadaGuatemalaGuyanaHaitiHondurasHong KongHungaryIndiaIndonesiaIranIraqIrelandIsraelItalyJamaicaJapanJordanKazakhstanKenyaKuwaitLaosLatin AmericaLatviaLebanonLiberiaLithuaniaMalaysiaMexicoMicronesiaMiddle AfricaMoldovaMoroccoNepalNetherlandsNicaraguaNigeriaNorth AmericaNorth MacedoniaNorthern AfricaNorthern EuropeNorwayOceaniaPakistanPanamaPeruPhilippinesPolandPortugalRomaniaRussiaSaudi ArabiaScotlandSenegalSerbiaSierra LeoneSingaporeSomaliaSouth AfricaSouth AmericaSouth Central AsiaSouth Eastern AsiaSouthern EuropeSpainSri LankaSt. Vincent and the GrenadinesSudanSwedenSwitzerlandSyriaTaiwanThailandTrinidad and TobagoTurkeyUgandaUkraineUruguayUzbekistanVenezuelaVietnamWest IndiesWestern AfricaWestern AsiaWestern EuropeYemenZaireZimbabweAzores
Immigrants from Korea
Race
Ancestry
AfghanAfricanAlaska NativeAlaskan AthabascanAlbanianAleutAlsatianAmericanApacheArabArapahoArgentineanArmenianAssyrian/Chaldean/SyriacAustralianAustrianBahamianBangladeshiBarbadianBasqueBelgianBelizeanBermudanBhutaneseBlackfeetBolivianBrazilianBritishBritish West IndianBulgarianBurmeseCajunCambodianCanadianCape VerdeanCarpatho RusynCelticCentral AmericanCentral American IndianCherokeeCheyenneChickasawChileanChineseChippewaChoctawColombianColvilleComancheCosta RicanCreeCreekCroatianCrowCubanCypriotCzechCzechoslovakianDanishDelawareDominicanDutchDutch West IndianEastern EuropeanEcuadorianEgyptianEnglishEstonianEthiopianEuropeanFijianFilipinoFinnishFrenchFrench American IndianFrench CanadianGermanGerman RussianGhanaianGreekGuamanian/ChamorroGuatemalanGuyaneseHaitianHmongHonduranHopiHoumaHungarianIcelanderIndian (Asian)IndonesianInupiatIranianIraqiIrishIroquoisIsraeliItalianJamaicanJapaneseJordanianKenyanKiowaKoreanLaotianLatvianLebaneseLiberianLithuanianLumbeeLuxembourgerMacedonianMalaysianMalteseMarshalleseMenomineeMexicanMexican American IndianMongolianMoroccanNative HawaiianNavajoNepaleseNew ZealanderNicaraguanNigerianNorthern EuropeanNorwegianOkinawanOsageOttawaPaiutePakistaniPalestinianPanamanianParaguayanPennsylvania GermanPeruvianPolishPortuguesePotawatomiPuebloPuerto RicanPuget Sound SalishRomanianRussianSalvadoranSamoanScandinavianScotch-IrishScottishSeminoleSenegaleseSerbianShoshoneSierra LeoneanSiouxSlavicSlovakSloveneSomaliSouth AfricanSouth AmericanSouth American IndianSoviet UnionSpaniardSpanishSpanish AmericanSpanish American IndianSri LankanSubsaharan AfricanSudaneseSwedishSwissSyrianTaiwaneseThaiTlingit-HaidaTohono O'OdhamTonganTrinidadian and TobagonianTsimshianTurkishU.S. Virgin IslanderUgandanUkrainianUruguayanUteVenezuelanVietnameseWelshWest IndianYakamaYaquiYugoslavianYumanYup'ikZimbabwean
Immigration
NonimmigrantsImmigrantsAfghanistanAfricaAlbaniaArgentinaArmeniaAsiaAustraliaAustriaBahamasBangladeshBarbadosBelarusBelgiumBelizeBoliviaBosnia and HerzegovinaBrazilBulgariaBurma/MyanmarCabo VerdeCambodiaCameroonCanadaCaribbeanCentral AmericaChileChinaColombiaCongoCosta RicaCroatiaCubaCzechoslovakiaDenmarkDominicaDominican RepublicEastern AfricaEastern AsiaEastern EuropeEcuadorEgyptEl SalvadorEnglandEritreaEthiopiaEuropeFijiFranceGermanyGhanaGreeceGrenadaGuatemalaGuyanaHaitiHondurasHong KongHungaryIndiaIndonesiaIranIraqIrelandIsraelItalyJamaicaJapanJordanKazakhstanKenyaKoreaKuwaitLaosLatin AmericaLatviaLebanonLiberiaLithuaniaMalaysiaMexicoMicronesiaMiddle AfricaMoldovaMoroccoNepalNetherlandsNicaraguaNigeriaNorth AmericaNorth MacedoniaNorthern AfricaNorthern EuropeNorwayOceaniaPakistanPanamaPeruPhilippinesPolandPortugalRomaniaRussiaSaudi ArabiaScotlandSenegalSerbiaSierra LeoneSingaporeSomaliaSouth AfricaSouth AmericaSouth Central AsiaSouth Eastern AsiaSouthern EuropeSpainSri LankaSt. Vincent and the GrenadinesSudanSwedenSwitzerlandSyriaTaiwanThailandTrinidad and TobagoTurkeyUgandaUkraineUruguayUzbekistanVenezuelaVietnamWest IndiesWestern AfricaWestern AsiaWestern EuropeYemenZaireZimbabweAzores
Single Father Poverty
Income
Poverty
Unemployment
Labor Participation
Family Structure
Vehicle Availability
Education Level
Disability

Single Father Poverty Comparison

Pima

Immigrants from Korea

Exceptional
Exceptional
14.8%
SINGLE FATHER POVERTY
100.0/ 100
METRIC RATING
40th/ 347
METRIC RANK
15.5%
SINGLE FATHER POVERTY
99.0/ 100
METRIC RATING
89th/ 347
METRIC RANK

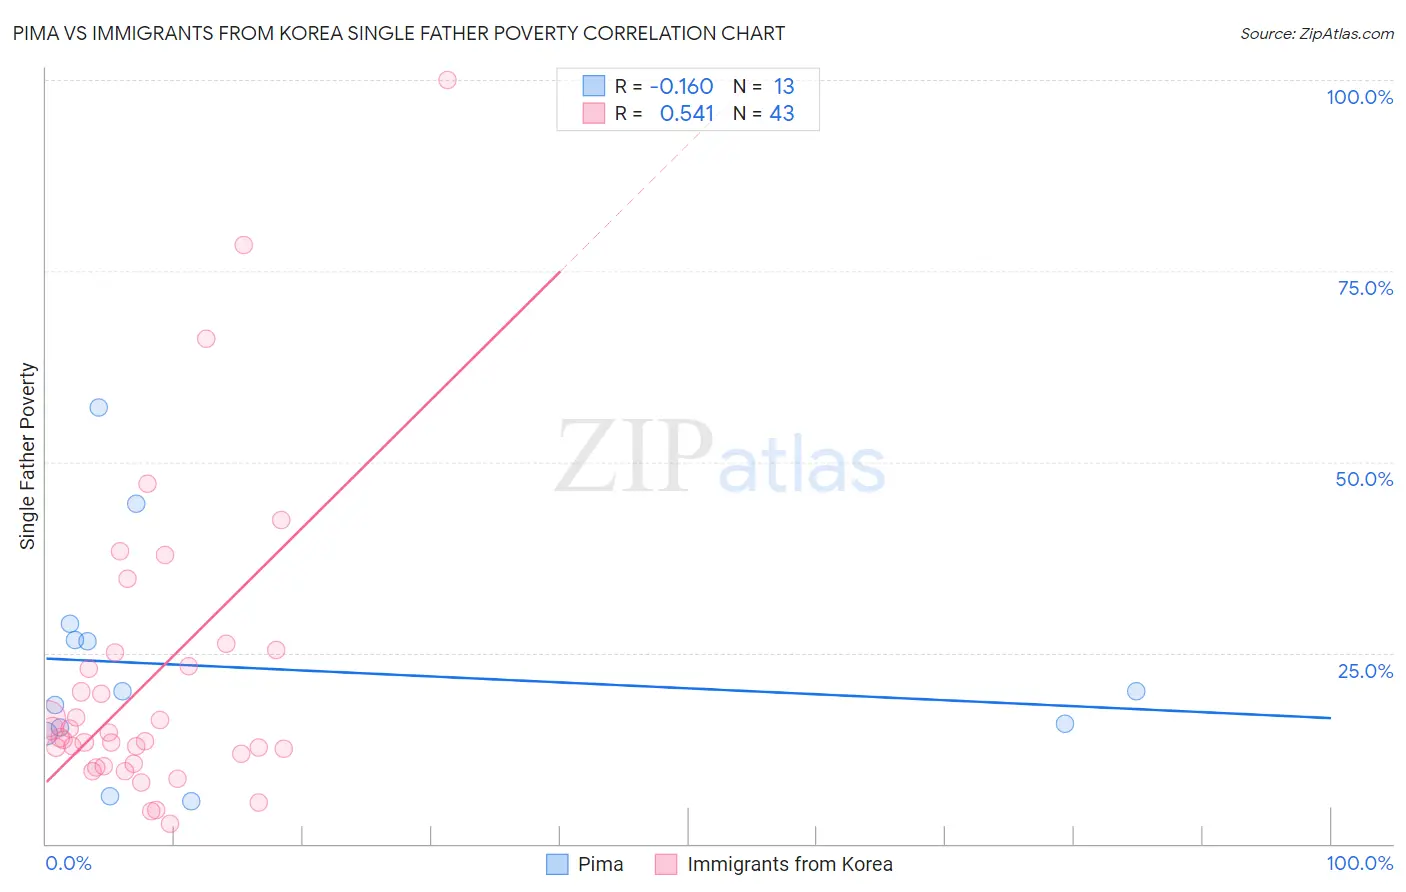
Pima vs Immigrants from Korea Single Father Poverty Correlation Chart

The statistical analysis conducted on geographies consisting of 58,926,282 people shows a poor negative correlation between the proportion of Pima and poverty level among single fathers in the United States with a correlation coefficient (R) of -0.160 and weighted average of 14.8%. Similarly, the statistical analysis conducted on geographies consisting of 322,299,273 people shows a substantial positive correlation between the proportion of Immigrants from Korea and poverty level among single fathers in the United States with a correlation coefficient (R) of 0.541 and weighted average of 15.5%, a difference of 4.8%.
Pima vs Immigrants from Korea Single Father Poverty

Single Father Poverty Correlation Summary

MeasurementPimaImmigrants from Korea
Minimum5.6%2.7%
Maximum57.1%100.0%
Range51.6%97.3%
Mean23.0%21.6%
Median20.0%13.9%
Interquartile 25% (IQ1)14.9%10.5%
Interquartile 75% (IQ3)27.7%25.0%
Interquartile Range (IQR)12.9%14.5%
Standard Deviation (Sample)14.4%19.8%
Standard Deviation (Population)13.9%19.6%

Similar Demographics by Single Father Poverty

Demographics Similar to Pima by Single Father Poverty

In terms of single father poverty, the demographic groups most similar to Pima are Indian (Asian) (14.8%, a difference of 0.17%), Immigrants from Nepal (14.8%, a difference of 0.17%), Immigrants from Asia (14.7%, a difference of 0.20%), Immigrants from Eritrea (14.8%, a difference of 0.21%), and Bolivian (14.7%, a difference of 0.37%).
DemographicsRating | RankSingle Father Poverty
Okinawans
100.0
/100
|
#33
Exceptional
14.6%
Egyptians
100.0
/100
|
#34
Exceptional
14.7%
Immigrants | Bolivia
100.0
/100
|
#35
Exceptional
14.7%
Immigrants | Indonesia
100.0
/100
|
#36
Exceptional
14.7%
Immigrants | Eastern Africa
100.0
/100
|
#37
Exceptional
14.7%
Bolivians
100.0
/100
|
#38
Exceptional
14.7%
Immigrants | Asia
100.0
/100
|
#39
Exceptional
14.7%
Pima
100.0
/100
|
#40
Exceptional
14.8%
Indians (Asian)
100.0
/100
|
#41
Exceptional
14.8%
Immigrants | Nepal
100.0
/100
|
#42
Exceptional
14.8%
Immigrants | Eritrea
100.0
/100
|
#43
Exceptional
14.8%
Salvadorans
100.0
/100
|
#44
Exceptional
14.9%
Immigrants | Somalia
100.0
/100
|
#45
Exceptional
14.9%
Immigrants | Cambodia
99.9
/100
|
#46
Exceptional
14.9%
Immigrants | China
99.9
/100
|
#47
Exceptional
14.9%

Demographics Similar to Immigrants from Korea by Single Father Poverty

In terms of single father poverty, the demographic groups most similar to Immigrants from Korea are Burmese (15.5%, a difference of 0.060%), Brazilian (15.5%, a difference of 0.090%), Immigrants from Russia (15.5%, a difference of 0.10%), Immigrants from Oceania (15.4%, a difference of 0.22%), and Mexican American Indian (15.5%, a difference of 0.23%).
DemographicsRating | RankSingle Father Poverty
Immigrants | Ukraine
99.4
/100
|
#82
Exceptional
15.4%
Chinese
99.3
/100
|
#83
Exceptional
15.4%
Peruvians
99.2
/100
|
#84
Exceptional
15.4%
Immigrants | Oceania
99.1
/100
|
#85
Exceptional
15.4%
Immigrants | Russia
99.0
/100
|
#86
Exceptional
15.5%
Brazilians
99.0
/100
|
#87
Exceptional
15.5%
Burmese
99.0
/100
|
#88
Exceptional
15.5%
Immigrants | Korea
99.0
/100
|
#89
Exceptional
15.5%
Mexican American Indians
98.7
/100
|
#90
Exceptional
15.5%
Immigrants | Romania
98.6
/100
|
#91
Exceptional
15.5%
Immigrants | Serbia
98.5
/100
|
#92
Exceptional
15.5%
Basques
98.4
/100
|
#93
Exceptional
15.5%
Immigrants | Uruguay
98.2
/100
|
#94
Exceptional
15.6%
Immigrants | Kazakhstan
98.2
/100
|
#95
Exceptional
15.6%
Immigrants | Belgium
98.1
/100
|
#96
Exceptional
15.6%