Pima vs Dutch West Indian Single Father Poverty
COMPARE
Pima
Dutch West Indian
Single Father Poverty
Single Father Poverty Comparison
Pima
Dutch West Indians
14.8%
SINGLE FATHER POVERTY
100.0/ 100
METRIC RATING
40th/ 347
METRIC RANK
19.2%
SINGLE FATHER POVERTY
0.0/ 100
METRIC RATING
318th/ 347
METRIC RANK
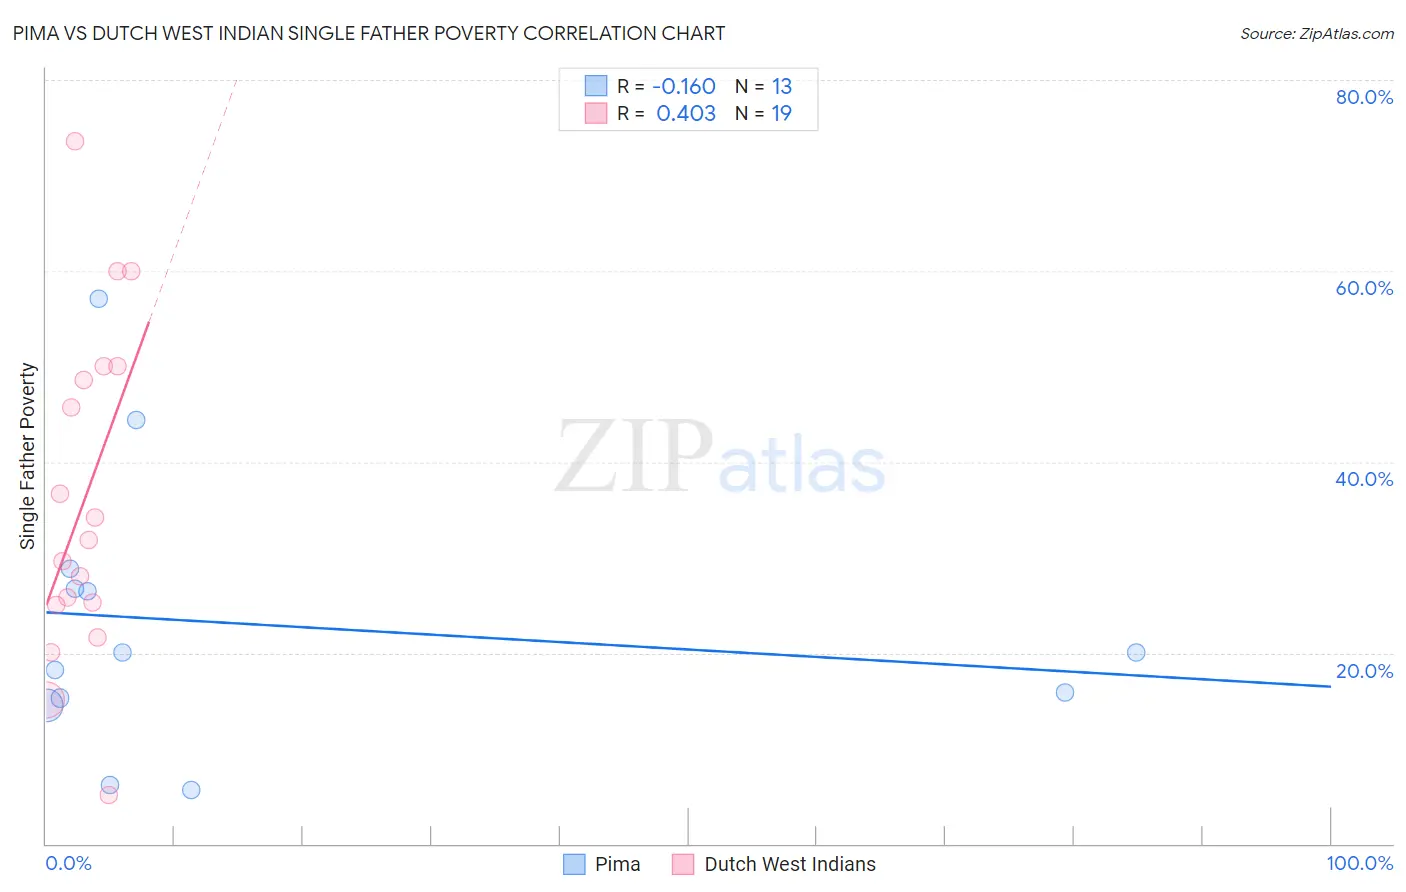
Pima vs Dutch West Indian Single Father Poverty Correlation Chart
The statistical analysis conducted on geographies consisting of 58,926,282 people shows a poor negative correlation between the proportion of Pima and poverty level among single fathers in the United States with a correlation coefficient (R) of -0.160 and weighted average of 14.8%. Similarly, the statistical analysis conducted on geographies consisting of 78,591,336 people shows a moderate positive correlation between the proportion of Dutch West Indians and poverty level among single fathers in the United States with a correlation coefficient (R) of 0.403 and weighted average of 19.2%, a difference of 30.0%.
Single Father Poverty Correlation Summary
| Measurement | Pima | Dutch West Indian |
| Minimum | 5.6% | 5.2% |
| Maximum | 57.1% | 73.5% |
| Range | 51.6% | 68.4% |
| Mean | 23.0% | 36.1% |
| Median | 20.0% | 31.8% |
| Interquartile 25% (IQ1) | 14.9% | 25.0% |
| Interquartile 75% (IQ3) | 27.7% | 50.0% |
| Interquartile Range (IQR) | 12.9% | 25.0% |
| Standard Deviation (Sample) | 14.4% | 17.5% |
| Standard Deviation (Population) | 13.9% | 17.1% |
Similar Demographics by Single Father Poverty
Demographics Similar to Pima by Single Father Poverty
In terms of single father poverty, the demographic groups most similar to Pima are Indian (Asian) (14.8%, a difference of 0.17%), Immigrants from Nepal (14.8%, a difference of 0.17%), Immigrants from Asia (14.7%, a difference of 0.20%), Immigrants from Eritrea (14.8%, a difference of 0.21%), and Bolivian (14.7%, a difference of 0.37%).
| Demographics | Rating | Rank | Single Father Poverty |
| Okinawans | 100.0 /100 | #33 | Exceptional 14.6% |
| Egyptians | 100.0 /100 | #34 | Exceptional 14.7% |
| Immigrants | Bolivia | 100.0 /100 | #35 | Exceptional 14.7% |
| Immigrants | Indonesia | 100.0 /100 | #36 | Exceptional 14.7% |
| Immigrants | Eastern Africa | 100.0 /100 | #37 | Exceptional 14.7% |
| Bolivians | 100.0 /100 | #38 | Exceptional 14.7% |
| Immigrants | Asia | 100.0 /100 | #39 | Exceptional 14.7% |
| Pima | 100.0 /100 | #40 | Exceptional 14.8% |
| Indians (Asian) | 100.0 /100 | #41 | Exceptional 14.8% |
| Immigrants | Nepal | 100.0 /100 | #42 | Exceptional 14.8% |
| Immigrants | Eritrea | 100.0 /100 | #43 | Exceptional 14.8% |
| Salvadorans | 100.0 /100 | #44 | Exceptional 14.9% |
| Immigrants | Somalia | 100.0 /100 | #45 | Exceptional 14.9% |
| Immigrants | Cambodia | 99.9 /100 | #46 | Exceptional 14.9% |
| Immigrants | China | 99.9 /100 | #47 | Exceptional 14.9% |
Demographics Similar to Dutch West Indians by Single Father Poverty
In terms of single father poverty, the demographic groups most similar to Dutch West Indians are Slovak (19.3%, a difference of 0.52%), Dominican (19.1%, a difference of 0.58%), Osage (19.0%, a difference of 0.89%), Chickasaw (19.0%, a difference of 1.3%), and Inupiat (19.5%, a difference of 1.4%).
| Demographics | Rating | Rank | Single Father Poverty |
| Immigrants | Nonimmigrants | 0.0 /100 | #311 | Tragic 18.8% |
| Immigrants | Dominica | 0.0 /100 | #312 | Tragic 18.9% |
| Potawatomi | 0.0 /100 | #313 | Tragic 18.9% |
| Delaware | 0.0 /100 | #314 | Tragic 18.9% |
| Chickasaw | 0.0 /100 | #315 | Tragic 19.0% |
| Osage | 0.0 /100 | #316 | Tragic 19.0% |
| Dominicans | 0.0 /100 | #317 | Tragic 19.1% |
| Dutch West Indians | 0.0 /100 | #318 | Tragic 19.2% |
| Slovaks | 0.0 /100 | #319 | Tragic 19.3% |
| Inupiat | 0.0 /100 | #320 | Tragic 19.5% |
| Cherokee | 0.0 /100 | #321 | Tragic 19.6% |
| Creek | 0.0 /100 | #322 | Tragic 19.8% |
| Pennsylvania Germans | 0.0 /100 | #323 | Tragic 20.0% |
| Americans | 0.0 /100 | #324 | Tragic 20.1% |
| Blacks/African Americans | 0.0 /100 | #325 | Tragic 20.4% |