Pennsylvania German vs Albanian Receiving Food Stamps

COMPARE

Pennsylvania German
Race
Ancestry
AfghanAfricanAlaska NativeAlaskan AthabascanAleutAlsatianAmericanApacheArabArapahoArgentineanArmenianAssyrian/Chaldean/SyriacAustralianAustrianBahamianBangladeshiBarbadianBasqueBelgianBelizeanBermudanBhutaneseBlackfeetBolivianBrazilianBritishBritish West IndianBulgarianBurmeseCajunCambodianCanadianCape VerdeanCarpatho RusynCelticCentral AmericanCentral American IndianCherokeeCheyenneChickasawChileanChineseChippewaChoctawColombianColvilleComancheCosta RicanCreeCreekCroatianCrowCubanCypriotCzechCzechoslovakianDanishDelawareDominicanDutchDutch West IndianEastern EuropeanEcuadorianEgyptianEnglishEstonianEthiopianEuropeanFijianFilipinoFinnishFrenchFrench American IndianFrench CanadianGermanGerman RussianGhanaianGreekGuamanian/ChamorroGuatemalanGuyaneseHaitianHmongHonduranHopiHoumaHungarianIcelanderIndian (Asian)IndonesianInupiatIranianIraqiIrishIroquoisIsraeliItalianJamaicanJapaneseJordanianKenyanKiowaKoreanLaotianLatvianLebaneseLiberianLithuanianLumbeeLuxembourgerMacedonianMalaysianMalteseMarshalleseMenomineeMexicanMexican American IndianMongolianMoroccanNative HawaiianNavajoNepaleseNew ZealanderNicaraguanNigerianNorthern EuropeanNorwegianOkinawanOsageOttawaPaiutePakistaniPalestinianPanamanianParaguayanPennsylvania GermanPeruvianPimaPolishPortuguesePotawatomiPuebloPuerto RicanPuget Sound SalishRomanianRussianSalvadoranSamoanScandinavianScotch-IrishScottishSeminoleSenegaleseSerbianShoshoneSierra LeoneanSiouxSlavicSlovakSloveneSomaliSouth AfricanSouth AmericanSouth American IndianSoviet UnionSpaniardSpanishSpanish AmericanSpanish American IndianSri LankanSubsaharan AfricanSudaneseSwedishSwissSyrianTaiwaneseThaiTlingit-HaidaTohono O'OdhamTonganTrinidadian and TobagonianTsimshianTurkishU.S. Virgin IslanderUgandanUkrainianUruguayanUteVenezuelanVietnameseWelshWest IndianYakamaYaquiYugoslavianYumanYup'ikZimbabwean
Immigration
NonimmigrantsImmigrantsAfghanistanAfricaAlbaniaArgentinaArmeniaAsiaAustraliaAustriaBahamasBangladeshBarbadosBelarusBelgiumBelizeBoliviaBosnia and HerzegovinaBrazilBulgariaBurma/MyanmarCabo VerdeCambodiaCameroonCanadaCaribbeanCentral AmericaChileChinaColombiaCongoCosta RicaCroatiaCubaCzechoslovakiaDenmarkDominicaDominican RepublicEastern AfricaEastern AsiaEastern EuropeEcuadorEgyptEl SalvadorEnglandEritreaEthiopiaEuropeFijiFranceGermanyGhanaGreeceGrenadaGuatemalaGuyanaHaitiHondurasHong KongHungaryIndiaIndonesiaIranIraqIrelandIsraelItalyJamaicaJapanJordanKazakhstanKenyaKoreaKuwaitLaosLatin AmericaLatviaLebanonLiberiaLithuaniaMalaysiaMexicoMicronesiaMiddle AfricaMoldovaMoroccoNepalNetherlandsNicaraguaNigeriaNorth AmericaNorth MacedoniaNorthern AfricaNorthern EuropeNorwayOceaniaPakistanPanamaPeruPhilippinesPolandPortugalRomaniaRussiaSaudi ArabiaScotlandSenegalSerbiaSierra LeoneSingaporeSomaliaSouth AfricaSouth AmericaSouth Central AsiaSouth Eastern AsiaSouthern EuropeSpainSri LankaSt. Vincent and the GrenadinesSudanSwedenSwitzerlandSyriaTaiwanThailandTrinidad and TobagoTurkeyUgandaUkraineUruguayUzbekistanVenezuelaVietnamWest IndiesWestern AfricaWestern AsiaWestern EuropeYemenZaireZimbabweAzores
Albanian
Race
Ancestry
AfghanAfricanAlaska NativeAlaskan AthabascanAlbanianAleutAlsatianAmericanApacheArabArapahoArgentineanArmenianAssyrian/Chaldean/SyriacAustralianAustrianBahamianBangladeshiBarbadianBasqueBelgianBelizeanBermudanBhutaneseBlackfeetBolivianBrazilianBritishBritish West IndianBulgarianBurmeseCajunCambodianCanadianCape VerdeanCarpatho RusynCelticCentral AmericanCentral American IndianCherokeeCheyenneChickasawChileanChineseChippewaChoctawColombianColvilleComancheCosta RicanCreeCreekCroatianCrowCubanCypriotCzechCzechoslovakianDanishDelawareDominicanDutchDutch West IndianEastern EuropeanEcuadorianEgyptianEnglishEstonianEthiopianEuropeanFijianFilipinoFinnishFrenchFrench American IndianFrench CanadianGermanGerman RussianGhanaianGreekGuamanian/ChamorroGuatemalanGuyaneseHaitianHmongHonduranHopiHoumaHungarianIcelanderIndian (Asian)IndonesianInupiatIranianIraqiIrishIroquoisIsraeliItalianJamaicanJapaneseJordanianKenyanKiowaKoreanLaotianLatvianLebaneseLiberianLithuanianLumbeeLuxembourgerMacedonianMalaysianMalteseMarshalleseMenomineeMexicanMexican American IndianMongolianMoroccanNative HawaiianNavajoNepaleseNew ZealanderNicaraguanNigerianNorthern EuropeanNorwegianOkinawanOsageOttawaPaiutePakistaniPalestinianPanamanianParaguayanPeruvianPimaPolishPortuguesePotawatomiPuebloPuerto RicanPuget Sound SalishRomanianRussianSalvadoranSamoanScandinavianScotch-IrishScottishSeminoleSenegaleseSerbianShoshoneSierra LeoneanSiouxSlavicSlovakSloveneSomaliSouth AfricanSouth AmericanSouth American IndianSoviet UnionSpaniardSpanishSpanish AmericanSpanish American IndianSri LankanSubsaharan AfricanSudaneseSwedishSwissSyrianTaiwaneseThaiTlingit-HaidaTohono O'OdhamTonganTrinidadian and TobagonianTsimshianTurkishU.S. Virgin IslanderUgandanUkrainianUruguayanUteVenezuelanVietnameseWelshWest IndianYakamaYaquiYugoslavianYumanYup'ikZimbabwean
Immigration
NonimmigrantsImmigrantsAfghanistanAfricaAlbaniaArgentinaArmeniaAsiaAustraliaAustriaBahamasBangladeshBarbadosBelarusBelgiumBelizeBoliviaBosnia and HerzegovinaBrazilBulgariaBurma/MyanmarCabo VerdeCambodiaCameroonCanadaCaribbeanCentral AmericaChileChinaColombiaCongoCosta RicaCroatiaCubaCzechoslovakiaDenmarkDominicaDominican RepublicEastern AfricaEastern AsiaEastern EuropeEcuadorEgyptEl SalvadorEnglandEritreaEthiopiaEuropeFijiFranceGermanyGhanaGreeceGrenadaGuatemalaGuyanaHaitiHondurasHong KongHungaryIndiaIndonesiaIranIraqIrelandIsraelItalyJamaicaJapanJordanKazakhstanKenyaKoreaKuwaitLaosLatin AmericaLatviaLebanonLiberiaLithuaniaMalaysiaMexicoMicronesiaMiddle AfricaMoldovaMoroccoNepalNetherlandsNicaraguaNigeriaNorth AmericaNorth MacedoniaNorthern AfricaNorthern EuropeNorwayOceaniaPakistanPanamaPeruPhilippinesPolandPortugalRomaniaRussiaSaudi ArabiaScotlandSenegalSerbiaSierra LeoneSingaporeSomaliaSouth AfricaSouth AmericaSouth Central AsiaSouth Eastern AsiaSouthern EuropeSpainSri LankaSt. Vincent and the GrenadinesSudanSwedenSwitzerlandSyriaTaiwanThailandTrinidad and TobagoTurkeyUgandaUkraineUruguayUzbekistanVenezuelaVietnamWest IndiesWestern AfricaWestern AsiaWestern EuropeYemenZaireZimbabweAzores
Receiving Food Stamps
Income
Poverty
Unemployment
Labor Participation
Family Structure
Vehicle Availability
Education Level
Disability

Receiving Food Stamps Comparison

Pennsylvania Germans

Albanians

Good
Fair
11.4%
RECEIVING FOOD STAMPS
68.4/ 100
METRIC RATING
161st/ 347
METRIC RANK
12.0%
RECEIVING FOOD STAMPS
35.4/ 100
METRIC RATING
187th/ 347
METRIC RANK

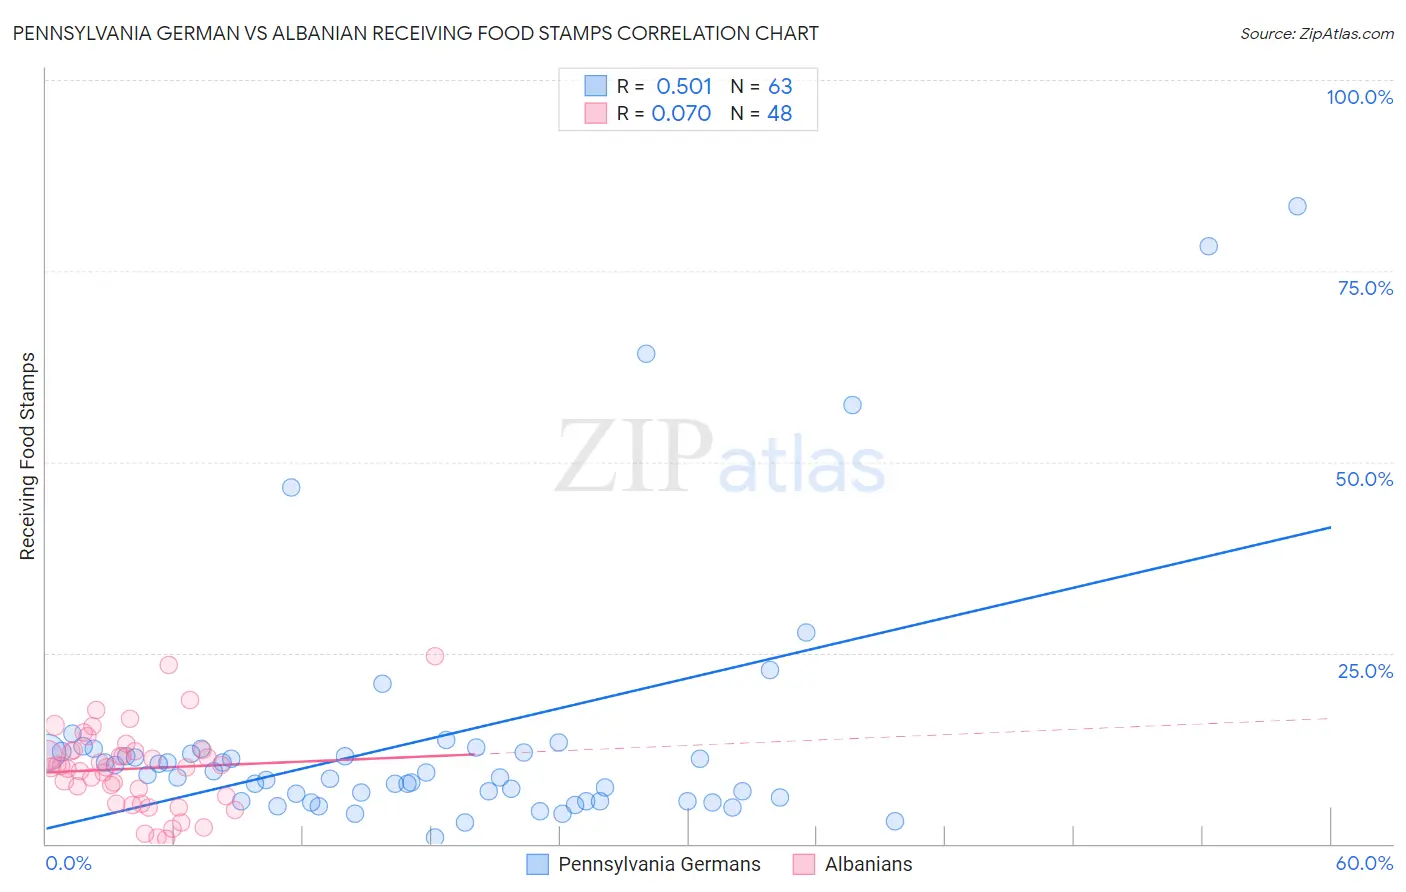
Pennsylvania German vs Albanian Receiving Food Stamps Correlation Chart

The statistical analysis conducted on geographies consisting of 233,858,684 people shows a substantial positive correlation between the proportion of Pennsylvania Germans and percentage of population receiving government assistance and/or food stamps in the United States with a correlation coefficient (R) of 0.501 and weighted average of 11.4%. Similarly, the statistical analysis conducted on geographies consisting of 192,875,347 people shows a slight positive correlation between the proportion of Albanians and percentage of population receiving government assistance and/or food stamps in the United States with a correlation coefficient (R) of 0.070 and weighted average of 12.0%, a difference of 4.9%.
Pennsylvania German vs Albanian Receiving Food Stamps

Receiving Food Stamps Correlation Summary

MeasurementPennsylvania GermanAlbanian
Minimum0.90%0.70%
Maximum83.5%24.5%
Range82.6%23.8%
Mean13.7%9.8%
Median8.9%10.0%
Interquartile 25% (IQ1)5.6%5.8%
Interquartile 75% (IQ3)12.0%12.2%
Interquartile Range (IQR)6.4%6.4%
Standard Deviation (Sample)16.6%5.3%
Standard Deviation (Population)16.4%5.2%

Similar Demographics by Receiving Food Stamps

Demographics Similar to Pennsylvania Germans by Receiving Food Stamps

In terms of receiving food stamps, the demographic groups most similar to Pennsylvania Germans are Alsatian (11.4%, a difference of 0.060%), French Canadian (11.4%, a difference of 0.18%), Immigrants from Oceania (11.4%, a difference of 0.34%), Immigrants from Southern Europe (11.5%, a difference of 0.43%), and Immigrants from Chile (11.5%, a difference of 0.55%).
DemographicsRating | RankReceiving Food Stamps
Armenians
81.4
/100
|
#154
Excellent
11.1%
Immigrants | Argentina
80.4
/100
|
#155
Excellent
11.2%
Immigrants | Afghanistan
75.6
/100
|
#156
Good
11.3%
Immigrants | Lebanon
75.2
/100
|
#157
Good
11.3%
Immigrants | Bosnia and Herzegovina
72.6
/100
|
#158
Good
11.3%
Immigrants | Oceania
70.4
/100
|
#159
Good
11.4%
French Canadians
69.5
/100
|
#160
Good
11.4%
Pennsylvania Germans
68.4
/100
|
#161
Good
11.4%
Alsatians
68.0
/100
|
#162
Good
11.4%
Immigrants | Southern Europe
65.8
/100
|
#163
Good
11.5%
Immigrants | Chile
65.0
/100
|
#164
Good
11.5%
Arabs
64.7
/100
|
#165
Good
11.5%
Immigrants | Belarus
62.8
/100
|
#166
Good
11.5%
Kenyans
60.2
/100
|
#167
Good
11.6%
Tlingit-Haida
59.1
/100
|
#168
Average
11.6%

Demographics Similar to Albanians by Receiving Food Stamps

In terms of receiving food stamps, the demographic groups most similar to Albanians are Spanish (12.0%, a difference of 0.22%), Immigrants from Iraq (12.0%, a difference of 0.25%), Sudanese (12.0%, a difference of 0.31%), Immigrants from Cameroon (12.0%, a difference of 0.44%), and Immigrants from Peru (12.0%, a difference of 0.50%).
DemographicsRating | RankReceiving Food Stamps
Uruguayans
44.8
/100
|
#180
Average
11.8%
South American Indians
41.7
/100
|
#181
Average
11.9%
Immigrants | Morocco
40.7
/100
|
#182
Average
11.9%
Immigrants | Uganda
40.3
/100
|
#183
Average
11.9%
Spaniards
39.8
/100
|
#184
Fair
11.9%
Immigrants | Iraq
37.1
/100
|
#185
Fair
12.0%
Spanish
36.9
/100
|
#186
Fair
12.0%
Albanians
35.4
/100
|
#187
Fair
12.0%
Sudanese
33.4
/100
|
#188
Fair
12.0%
Immigrants | Cameroon
32.5
/100
|
#189
Fair
12.0%
Immigrants | Peru
32.2
/100
|
#190
Fair
12.0%
Venezuelans
32.1
/100
|
#191
Fair
12.0%
Samoans
31.0
/100
|
#192
Fair
12.1%
Immigrants | Fiji
27.8
/100
|
#193
Fair
12.1%
Immigrants | Sudan
27.1
/100
|
#194
Fair
12.1%