Moroccan vs Bhutanese Receiving Food Stamps

COMPARE

Moroccan
Race
Ancestry
AfghanAfricanAlaska NativeAlaskan AthabascanAlbanianAleutAlsatianAmericanApacheArabArapahoArgentineanArmenianAssyrian/Chaldean/SyriacAustralianAustrianBahamianBangladeshiBarbadianBasqueBelgianBelizeanBermudanBlackfeetBolivianBrazilianBritishBritish West IndianBulgarianBurmeseCajunCambodianCanadianCape VerdeanCarpatho RusynCelticCentral AmericanCentral American IndianCherokeeCheyenneChickasawChileanChineseChippewaChoctawColombianColvilleComancheCosta RicanCreeCreekCroatianCrowCubanCypriotCzechCzechoslovakianDanishDelawareDominicanDutchDutch West IndianEastern EuropeanEcuadorianEgyptianEnglishEstonianEthiopianEuropeanFijianFilipinoFinnishFrenchFrench American IndianFrench CanadianGermanGerman RussianGhanaianGreekGuamanian/ChamorroGuatemalanGuyaneseHaitianHmongHonduranHopiHoumaHungarianIcelanderIndian (Asian)IndonesianInupiatIranianIraqiIrishIroquoisIsraeliItalianJamaicanJapaneseJordanianKenyanKiowaKoreanLaotianLatvianLebaneseLiberianLithuanianLumbeeLuxembourgerMacedonianMalaysianMalteseMarshalleseMenomineeMexicanMexican American IndianMongolianMoroccanNative HawaiianNavajoNepaleseNew ZealanderNicaraguanNigerianNorthern EuropeanNorwegianOkinawanOsageOttawaPaiutePakistaniPalestinianPanamanianParaguayanPennsylvania GermanPeruvianPimaPolishPortuguesePotawatomiPuebloPuerto RicanPuget Sound SalishRomanianRussianSalvadoranSamoanScandinavianScotch-IrishScottishSeminoleSenegaleseSerbianShoshoneSierra LeoneanSiouxSlavicSlovakSloveneSomaliSouth AfricanSouth AmericanSouth American IndianSoviet UnionSpaniardSpanishSpanish AmericanSpanish American IndianSri LankanSubsaharan AfricanSudaneseSwedishSwissSyrianTaiwaneseThaiTlingit-HaidaTohono O'OdhamTonganTrinidadian and TobagonianTsimshianTurkishU.S. Virgin IslanderUgandanUkrainianUruguayanUteVenezuelanVietnameseWelshWest IndianYakamaYaquiYugoslavianYumanYup'ikZimbabwean
Immigration
NonimmigrantsImmigrantsAfghanistanAfricaAlbaniaArgentinaArmeniaAsiaAustraliaAustriaBahamasBangladeshBarbadosBelarusBelgiumBelizeBoliviaBosnia and HerzegovinaBrazilBulgariaBurma/MyanmarCabo VerdeCambodiaCameroonCanadaCaribbeanCentral AmericaChileChinaColombiaCongoCosta RicaCroatiaCubaCzechoslovakiaDenmarkDominicaDominican RepublicEastern AfricaEastern AsiaEastern EuropeEcuadorEgyptEl SalvadorEnglandEritreaEthiopiaEuropeFijiFranceGermanyGhanaGreeceGrenadaGuatemalaGuyanaHaitiHondurasHong KongHungaryIndiaIndonesiaIranIraqIrelandIsraelItalyJamaicaJapanJordanKazakhstanKenyaKoreaKuwaitLaosLatin AmericaLatviaLebanonLiberiaLithuaniaMalaysiaMexicoMicronesiaMiddle AfricaMoldovaMoroccoNepalNetherlandsNicaraguaNigeriaNorth AmericaNorth MacedoniaNorthern AfricaNorthern EuropeNorwayOceaniaPakistanPanamaPeruPhilippinesPolandPortugalRomaniaRussiaSaudi ArabiaScotlandSenegalSerbiaSierra LeoneSingaporeSomaliaSouth AfricaSouth AmericaSouth Central AsiaSouth Eastern AsiaSouthern EuropeSpainSri LankaSt. Vincent and the GrenadinesSudanSwedenSwitzerlandSyriaTaiwanThailandTrinidad and TobagoTurkeyUgandaUkraineUruguayUzbekistanVenezuelaVietnamWest IndiesWestern AfricaWestern AsiaWestern EuropeYemenZaireZimbabweAzores
Bhutanese
Race
Ancestry
AfghanAfricanAlaska NativeAlaskan AthabascanAlbanianAleutAlsatianAmericanApacheArabArapahoArgentineanArmenianAssyrian/Chaldean/SyriacAustralianAustrianBahamianBangladeshiBarbadianBasqueBelgianBelizeanBermudanBhutaneseBlackfeetBolivianBrazilianBritishBritish West IndianBulgarianBurmeseCajunCambodianCanadianCape VerdeanCarpatho RusynCelticCentral AmericanCentral American IndianCherokeeCheyenneChickasawChileanChineseChippewaChoctawColombianColvilleComancheCosta RicanCreeCreekCroatianCrowCubanCypriotCzechCzechoslovakianDanishDelawareDominicanDutchDutch West IndianEastern EuropeanEcuadorianEgyptianEnglishEstonianEthiopianEuropeanFijianFilipinoFinnishFrenchFrench American IndianFrench CanadianGermanGerman RussianGhanaianGreekGuamanian/ChamorroGuatemalanGuyaneseHaitianHmongHonduranHopiHoumaHungarianIcelanderIndian (Asian)IndonesianInupiatIranianIraqiIrishIroquoisIsraeliItalianJamaicanJapaneseJordanianKenyanKiowaKoreanLaotianLatvianLebaneseLiberianLithuanianLumbeeLuxembourgerMacedonianMalaysianMalteseMarshalleseMenomineeMexicanMexican American IndianMongolianNative HawaiianNavajoNepaleseNew ZealanderNicaraguanNigerianNorthern EuropeanNorwegianOkinawanOsageOttawaPaiutePakistaniPalestinianPanamanianParaguayanPennsylvania GermanPeruvianPimaPolishPortuguesePotawatomiPuebloPuerto RicanPuget Sound SalishRomanianRussianSalvadoranSamoanScandinavianScotch-IrishScottishSeminoleSenegaleseSerbianShoshoneSierra LeoneanSiouxSlavicSlovakSloveneSomaliSouth AfricanSouth AmericanSouth American IndianSoviet UnionSpaniardSpanishSpanish AmericanSpanish American IndianSri LankanSubsaharan AfricanSudaneseSwedishSwissSyrianTaiwaneseThaiTlingit-HaidaTohono O'OdhamTonganTrinidadian and TobagonianTsimshianTurkishU.S. Virgin IslanderUgandanUkrainianUruguayanUteVenezuelanVietnameseWelshWest IndianYakamaYaquiYugoslavianYumanYup'ikZimbabwean
Immigration
NonimmigrantsImmigrantsAfghanistanAfricaAlbaniaArgentinaArmeniaAsiaAustraliaAustriaBahamasBangladeshBarbadosBelarusBelgiumBelizeBoliviaBosnia and HerzegovinaBrazilBulgariaBurma/MyanmarCabo VerdeCambodiaCameroonCanadaCaribbeanCentral AmericaChileChinaColombiaCongoCosta RicaCroatiaCubaCzechoslovakiaDenmarkDominicaDominican RepublicEastern AfricaEastern AsiaEastern EuropeEcuadorEgyptEl SalvadorEnglandEritreaEthiopiaEuropeFijiFranceGermanyGhanaGreeceGrenadaGuatemalaGuyanaHaitiHondurasHong KongHungaryIndiaIndonesiaIranIraqIrelandIsraelItalyJamaicaJapanJordanKazakhstanKenyaKoreaKuwaitLaosLatin AmericaLatviaLebanonLiberiaLithuaniaMalaysiaMexicoMicronesiaMiddle AfricaMoldovaMoroccoNepalNetherlandsNicaraguaNigeriaNorth AmericaNorth MacedoniaNorthern AfricaNorthern EuropeNorwayOceaniaPakistanPanamaPeruPhilippinesPolandPortugalRomaniaRussiaSaudi ArabiaScotlandSenegalSerbiaSierra LeoneSingaporeSomaliaSouth AfricaSouth AmericaSouth Central AsiaSouth Eastern AsiaSouthern EuropeSpainSri LankaSt. Vincent and the GrenadinesSudanSwedenSwitzerlandSyriaTaiwanThailandTrinidad and TobagoTurkeyUgandaUkraineUruguayUzbekistanVenezuelaVietnamWest IndiesWestern AfricaWestern AsiaWestern EuropeYemenZaireZimbabweAzores
Receiving Food Stamps
Income
Poverty
Unemployment
Labor Participation
Family Structure
Vehicle Availability
Education Level
Disability

Receiving Food Stamps Comparison

Moroccans

Bhutanese

Tragic
Exceptional
12.8%
RECEIVING FOOD STAMPS
7.6/ 100
METRIC RATING
213th/ 347
METRIC RANK
9.2%
RECEIVING FOOD STAMPS
99.8/ 100
METRIC RATING
27th/ 347
METRIC RANK

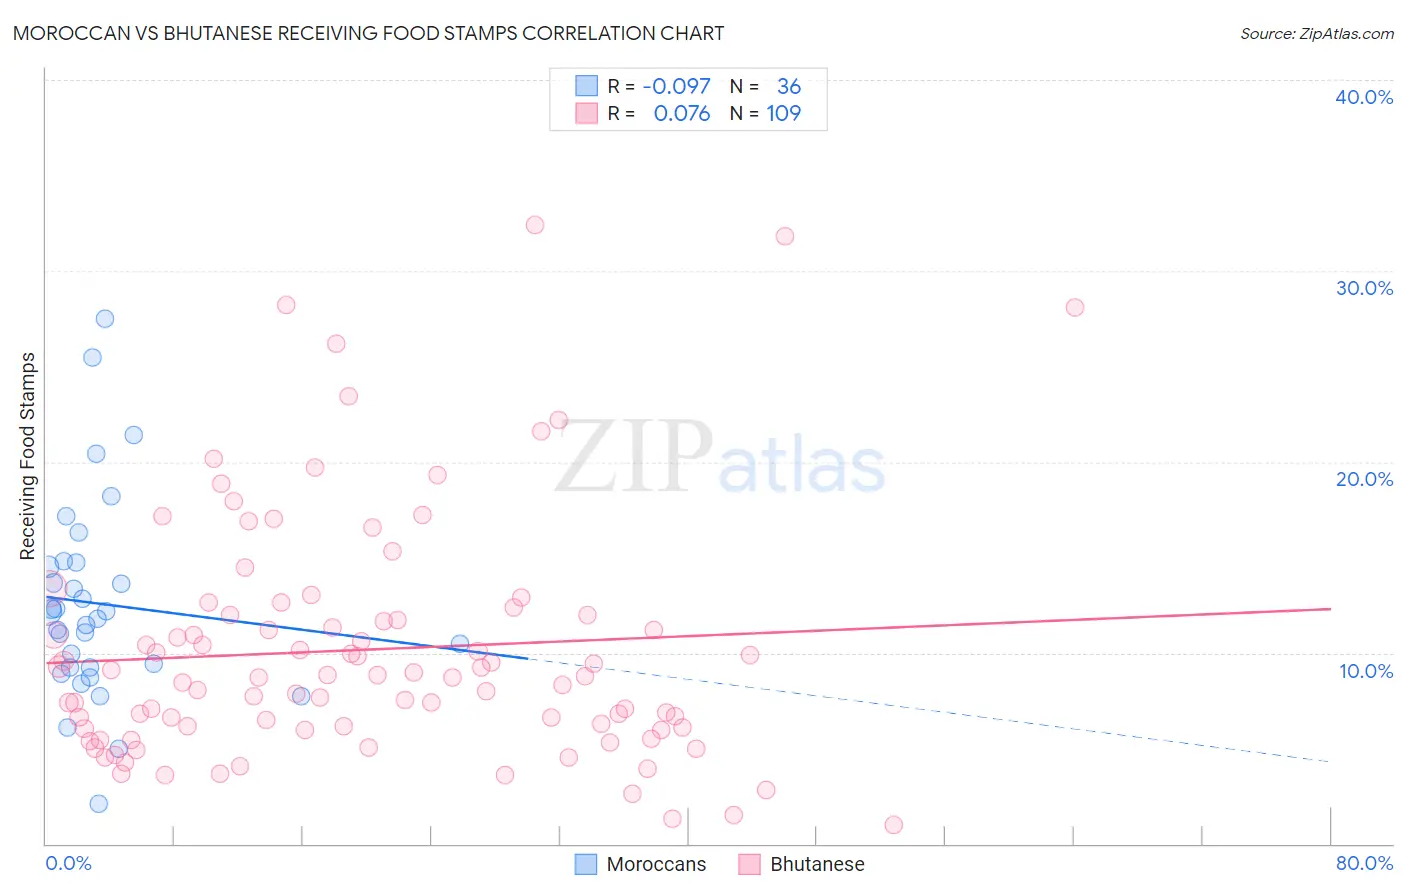
Moroccan vs Bhutanese Receiving Food Stamps Correlation Chart

The statistical analysis conducted on geographies consisting of 201,594,940 people shows a slight negative correlation between the proportion of Moroccans and percentage of population receiving government assistance and/or food stamps in the United States with a correlation coefficient (R) of -0.097 and weighted average of 12.8%. Similarly, the statistical analysis conducted on geographies consisting of 453,770,052 people shows a slight positive correlation between the proportion of Bhutanese and percentage of population receiving government assistance and/or food stamps in the United States with a correlation coefficient (R) of 0.076 and weighted average of 9.2%, a difference of 38.5%.
Moroccan vs Bhutanese Receiving Food Stamps

Receiving Food Stamps Correlation Summary

MeasurementMoroccanBhutanese
Minimum2.1%1.0%
Maximum27.5%32.4%
Range25.4%31.4%
Mean12.6%10.2%
Median12.0%8.8%
Interquartile 25% (IQ1)9.2%6.0%
Interquartile 75% (IQ3)14.6%12.0%
Interquartile Range (IQR)5.4%6.0%
Standard Deviation (Sample)5.3%6.3%
Standard Deviation (Population)5.2%6.3%

Similar Demographics by Receiving Food Stamps

Demographics Similar to Moroccans by Receiving Food Stamps

In terms of receiving food stamps, the demographic groups most similar to Moroccans are Immigrants from Africa (12.8%, a difference of 0.030%), Malaysian (12.7%, a difference of 0.40%), Native Hawaiian (12.8%, a difference of 0.47%), Immigrants from South America (12.8%, a difference of 0.58%), and Immigrants from Burma/Myanmar (12.9%, a difference of 0.84%).
DemographicsRating | RankReceiving Food Stamps
Immigrants | Thailand
17.0
/100
|
#206
Poor
12.4%
South Americans
16.0
/100
|
#207
Poor
12.4%
Potawatomi
14.6
/100
|
#208
Poor
12.5%
Immigrants | Sierra Leone
12.9
/100
|
#209
Poor
12.5%
Immigrants | Uruguay
12.8
/100
|
#210
Poor
12.5%
Colombians
10.2
/100
|
#211
Poor
12.6%
Malaysians
8.5
/100
|
#212
Tragic
12.7%
Moroccans
7.6
/100
|
#213
Tragic
12.8%
Immigrants | Africa
7.6
/100
|
#214
Tragic
12.8%
Native Hawaiians
6.7
/100
|
#215
Tragic
12.8%
Immigrants | South America
6.5
/100
|
#216
Tragic
12.8%
Immigrants | Burma/Myanmar
6.0
/100
|
#217
Tragic
12.9%
Hawaiians
5.4
/100
|
#218
Tragic
12.9%
Immigrants | Middle Africa
5.4
/100
|
#219
Tragic
12.9%
Immigrants | Colombia
5.3
/100
|
#220
Tragic
12.9%

Demographics Similar to Bhutanese by Receiving Food Stamps

In terms of receiving food stamps, the demographic groups most similar to Bhutanese are Czech (9.2%, a difference of 0.010%), Swedish (9.2%, a difference of 0.24%), Immigrants from Lithuania (9.2%, a difference of 0.28%), Immigrants from Ireland (9.2%, a difference of 0.43%), and Immigrants from Northern Europe (9.2%, a difference of 0.54%).
DemographicsRating | RankReceiving Food Stamps
Latvians
99.8
/100
|
#20
Exceptional
9.1%
Luxembourgers
99.8
/100
|
#21
Exceptional
9.1%
Immigrants | Australia
99.8
/100
|
#22
Exceptional
9.2%
Eastern Europeans
99.8
/100
|
#23
Exceptional
9.2%
Immigrants | Northern Europe
99.8
/100
|
#24
Exceptional
9.2%
Immigrants | Ireland
99.8
/100
|
#25
Exceptional
9.2%
Swedes
99.8
/100
|
#26
Exceptional
9.2%
Bhutanese
99.8
/100
|
#27
Exceptional
9.2%
Czechs
99.8
/100
|
#28
Exceptional
9.2%
Immigrants | Lithuania
99.8
/100
|
#29
Exceptional
9.2%
Immigrants | Sweden
99.7
/100
|
#30
Exceptional
9.3%
Immigrants | Eastern Asia
99.7
/100
|
#31
Exceptional
9.3%
Bolivians
99.7
/100
|
#32
Exceptional
9.3%
Zimbabweans
99.6
/100
|
#33
Exceptional
9.5%
Turks
99.6
/100
|
#34
Exceptional
9.5%