Indian (Asian) vs Nicaraguan Receiving Food Stamps

COMPARE

Indian (Asian)
Race
Ancestry
AfghanAfricanAlaska NativeAlaskan AthabascanAlbanianAleutAlsatianAmericanApacheArabArapahoArgentineanArmenianAssyrian/Chaldean/SyriacAustralianAustrianBahamianBangladeshiBarbadianBasqueBelgianBelizeanBermudanBhutaneseBlackfeetBolivianBrazilianBritishBritish West IndianBulgarianBurmeseCajunCambodianCanadianCape VerdeanCarpatho RusynCelticCentral AmericanCentral American IndianCherokeeCheyenneChickasawChileanChineseChippewaChoctawColombianColvilleComancheCosta RicanCreeCreekCroatianCrowCubanCypriotCzechCzechoslovakianDanishDelawareDominicanDutchDutch West IndianEastern EuropeanEcuadorianEgyptianEnglishEstonianEthiopianEuropeanFijianFilipinoFinnishFrenchFrench American IndianFrench CanadianGermanGerman RussianGhanaianGreekGuamanian/ChamorroGuatemalanGuyaneseHaitianHmongHonduranHopiHoumaHungarianIcelanderIndian (Asian)IndonesianInupiatIranianIraqiIrishIroquoisIsraeliItalianJamaicanJapaneseJordanianKenyanKiowaKoreanLaotianLatvianLebaneseLiberianLithuanianLumbeeLuxembourgerMacedonianMalaysianMalteseMarshalleseMenomineeMexicanMexican American IndianMongolianMoroccanNative HawaiianNavajoNepaleseNew ZealanderNigerianNorthern EuropeanNorwegianOkinawanOsageOttawaPaiutePakistaniPalestinianPanamanianParaguayanPennsylvania GermanPeruvianPimaPolishPortuguesePotawatomiPuebloPuerto RicanPuget Sound SalishRomanianRussianSalvadoranSamoanScandinavianScotch-IrishScottishSeminoleSenegaleseSerbianShoshoneSierra LeoneanSiouxSlavicSlovakSloveneSomaliSouth AfricanSouth AmericanSouth American IndianSoviet UnionSpaniardSpanishSpanish AmericanSpanish American IndianSri LankanSubsaharan AfricanSudaneseSwedishSwissSyrianTaiwaneseThaiTlingit-HaidaTohono O'OdhamTonganTrinidadian and TobagonianTsimshianTurkishU.S. Virgin IslanderUgandanUkrainianUruguayanUteVenezuelanVietnameseWelshWest IndianYakamaYaquiYugoslavianYumanYup'ikZimbabwean
Immigration
NonimmigrantsImmigrantsAfghanistanAfricaAlbaniaArgentinaArmeniaAsiaAustraliaAustriaBahamasBangladeshBarbadosBelarusBelgiumBelizeBoliviaBosnia and HerzegovinaBrazilBulgariaBurma/MyanmarCabo VerdeCambodiaCameroonCanadaCaribbeanCentral AmericaChileChinaColombiaCongoCosta RicaCroatiaCubaCzechoslovakiaDenmarkDominicaDominican RepublicEastern AfricaEastern AsiaEastern EuropeEcuadorEgyptEl SalvadorEnglandEritreaEthiopiaEuropeFijiFranceGermanyGhanaGreeceGrenadaGuatemalaGuyanaHaitiHondurasHong KongHungaryIndiaIndonesiaIranIraqIrelandIsraelItalyJamaicaJapanJordanKazakhstanKenyaKoreaKuwaitLaosLatin AmericaLatviaLebanonLiberiaLithuaniaMalaysiaMexicoMicronesiaMiddle AfricaMoldovaMoroccoNepalNetherlandsNicaraguaNigeriaNorth AmericaNorth MacedoniaNorthern AfricaNorthern EuropeNorwayOceaniaPakistanPanamaPeruPhilippinesPolandPortugalRomaniaRussiaSaudi ArabiaScotlandSenegalSerbiaSierra LeoneSingaporeSomaliaSouth AfricaSouth AmericaSouth Central AsiaSouth Eastern AsiaSouthern EuropeSpainSri LankaSt. Vincent and the GrenadinesSudanSwedenSwitzerlandSyriaTaiwanThailandTrinidad and TobagoTurkeyUgandaUkraineUruguayUzbekistanVenezuelaVietnamWest IndiesWestern AfricaWestern AsiaWestern EuropeYemenZaireZimbabweAzores
Nicaraguan
Race
Ancestry
AfghanAfricanAlaska NativeAlaskan AthabascanAlbanianAleutAlsatianAmericanApacheArabArapahoArgentineanArmenianAssyrian/Chaldean/SyriacAustralianAustrianBahamianBangladeshiBarbadianBasqueBelgianBelizeanBermudanBhutaneseBlackfeetBolivianBrazilianBritishBritish West IndianBulgarianBurmeseCajunCambodianCanadianCape VerdeanCarpatho RusynCelticCentral AmericanCentral American IndianCherokeeCheyenneChickasawChileanChineseChippewaChoctawColombianColvilleComancheCosta RicanCreeCreekCroatianCrowCubanCypriotCzechCzechoslovakianDanishDelawareDominicanDutchDutch West IndianEastern EuropeanEcuadorianEgyptianEnglishEstonianEthiopianEuropeanFijianFilipinoFinnishFrenchFrench American IndianFrench CanadianGermanGerman RussianGhanaianGreekGuamanian/ChamorroGuatemalanGuyaneseHaitianHmongHonduranHopiHoumaHungarianIcelanderIndonesianInupiatIranianIraqiIrishIroquoisIsraeliItalianJamaicanJapaneseJordanianKenyanKiowaKoreanLaotianLatvianLebaneseLiberianLithuanianLumbeeLuxembourgerMacedonianMalaysianMalteseMarshalleseMenomineeMexicanMexican American IndianMongolianMoroccanNative HawaiianNavajoNepaleseNew ZealanderNicaraguanNigerianNorthern EuropeanNorwegianOkinawanOsageOttawaPaiutePakistaniPalestinianPanamanianParaguayanPennsylvania GermanPeruvianPimaPolishPortuguesePotawatomiPuebloPuerto RicanPuget Sound SalishRomanianRussianSalvadoranSamoanScandinavianScotch-IrishScottishSeminoleSenegaleseSerbianShoshoneSierra LeoneanSiouxSlavicSlovakSloveneSomaliSouth AfricanSouth AmericanSouth American IndianSoviet UnionSpaniardSpanishSpanish AmericanSpanish American IndianSri LankanSubsaharan AfricanSudaneseSwedishSwissSyrianTaiwaneseThaiTlingit-HaidaTohono O'OdhamTonganTrinidadian and TobagonianTsimshianTurkishU.S. Virgin IslanderUgandanUkrainianUruguayanUteVenezuelanVietnameseWelshWest IndianYakamaYaquiYugoslavianYumanYup'ikZimbabwean
Immigration
NonimmigrantsImmigrantsAfghanistanAfricaAlbaniaArgentinaArmeniaAsiaAustraliaAustriaBahamasBangladeshBarbadosBelarusBelgiumBelizeBoliviaBosnia and HerzegovinaBrazilBulgariaBurma/MyanmarCabo VerdeCambodiaCameroonCanadaCaribbeanCentral AmericaChileChinaColombiaCongoCosta RicaCroatiaCubaCzechoslovakiaDenmarkDominicaDominican RepublicEastern AfricaEastern AsiaEastern EuropeEcuadorEgyptEl SalvadorEnglandEritreaEthiopiaEuropeFijiFranceGermanyGhanaGreeceGrenadaGuatemalaGuyanaHaitiHondurasHong KongHungaryIndiaIndonesiaIranIraqIrelandIsraelItalyJamaicaJapanJordanKazakhstanKenyaKoreaKuwaitLaosLatin AmericaLatviaLebanonLiberiaLithuaniaMalaysiaMexicoMicronesiaMiddle AfricaMoldovaMoroccoNepalNetherlandsNicaraguaNigeriaNorth AmericaNorth MacedoniaNorthern AfricaNorthern EuropeNorwayOceaniaPakistanPanamaPeruPhilippinesPolandPortugalRomaniaRussiaSaudi ArabiaScotlandSenegalSerbiaSierra LeoneSingaporeSomaliaSouth AfricaSouth AmericaSouth Central AsiaSouth Eastern AsiaSouthern EuropeSpainSri LankaSt. Vincent and the GrenadinesSudanSwedenSwitzerlandSyriaTaiwanThailandTrinidad and TobagoTurkeyUgandaUkraineUruguayUzbekistanVenezuelaVietnamWest IndiesWestern AfricaWestern AsiaWestern EuropeYemenZaireZimbabweAzores
Receiving Food Stamps
Income
Poverty
Unemployment
Labor Participation
Family Structure
Vehicle Availability
Education Level
Disability

Receiving Food Stamps Comparison

Indians (Asian)

Nicaraguans

Exceptional
Tragic
9.6%
RECEIVING FOOD STAMPS
99.4/ 100
METRIC RATING
47th/ 347
METRIC RANK
16.1%
RECEIVING FOOD STAMPS
0.0/ 100
METRIC RATING
303rd/ 347
METRIC RANK

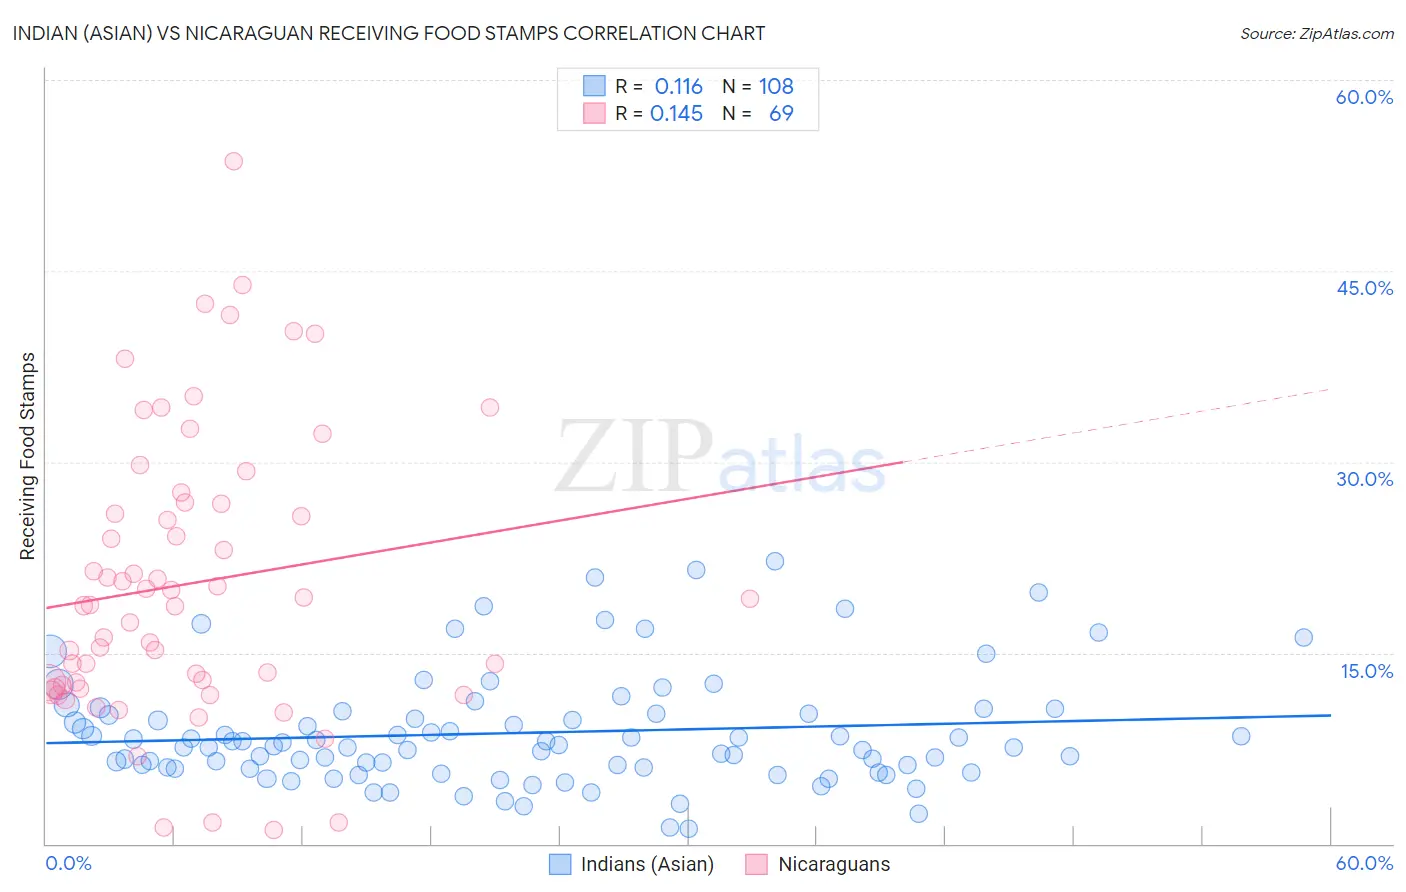
Indian (Asian) vs Nicaraguan Receiving Food Stamps Correlation Chart

The statistical analysis conducted on geographies consisting of 492,865,667 people shows a poor positive correlation between the proportion of Indians (Asian) and percentage of population receiving government assistance and/or food stamps in the United States with a correlation coefficient (R) of 0.116 and weighted average of 9.6%. Similarly, the statistical analysis conducted on geographies consisting of 285,345,977 people shows a poor positive correlation between the proportion of Nicaraguans and percentage of population receiving government assistance and/or food stamps in the United States with a correlation coefficient (R) of 0.145 and weighted average of 16.1%, a difference of 67.6%.
Indian (Asian) vs Nicaraguan Receiving Food Stamps

Receiving Food Stamps Correlation Summary

MeasurementIndian (Asian)Nicaraguan
Minimum1.2%1.1%
Maximum22.2%53.6%
Range21.0%52.5%
Mean8.7%20.4%
Median7.7%18.7%
Interquartile 25% (IQ1)5.9%12.3%
Interquartile 75% (IQ3)10.2%26.7%
Interquartile Range (IQR)4.2%14.4%
Standard Deviation (Sample)4.4%11.2%
Standard Deviation (Population)4.4%11.1%

Similar Demographics by Receiving Food Stamps

Demographics Similar to Indians (Asian) by Receiving Food Stamps

In terms of receiving food stamps, the demographic groups most similar to Indians (Asian) are Australian (9.6%, a difference of 0.070%), Russian (9.6%, a difference of 0.11%), Immigrants from Czechoslovakia (9.6%, a difference of 0.13%), Immigrants from Belgium (9.6%, a difference of 0.15%), and Immigrants from Denmark (9.6%, a difference of 0.17%).
DemographicsRating | RankReceiving Food Stamps
Immigrants | Netherlands
99.5
/100
|
#40
Exceptional
9.5%
Cambodians
99.5
/100
|
#41
Exceptional
9.5%
Immigrants | China
99.5
/100
|
#42
Exceptional
9.6%
Croatians
99.5
/100
|
#43
Exceptional
9.6%
Immigrants | Denmark
99.4
/100
|
#44
Exceptional
9.6%
Immigrants | Belgium
99.4
/100
|
#45
Exceptional
9.6%
Australians
99.4
/100
|
#46
Exceptional
9.6%
Indians (Asian)
99.4
/100
|
#47
Exceptional
9.6%
Russians
99.4
/100
|
#48
Exceptional
9.6%
Immigrants | Czechoslovakia
99.4
/100
|
#49
Exceptional
9.6%
Lithuanians
99.4
/100
|
#50
Exceptional
9.7%
Asians
99.3
/100
|
#51
Exceptional
9.7%
Immigrants | South Africa
99.3
/100
|
#52
Exceptional
9.7%
Tongans
99.3
/100
|
#53
Exceptional
9.7%
Swiss
99.3
/100
|
#54
Exceptional
9.7%

Demographics Similar to Nicaraguans by Receiving Food Stamps

In terms of receiving food stamps, the demographic groups most similar to Nicaraguans are Immigrants from West Indies (16.1%, a difference of 0.090%), West Indian (16.3%, a difference of 0.68%), Trinidadian and Tobagonian (16.0%, a difference of 1.0%), Immigrants from Bangladesh (15.9%, a difference of 1.5%), and Immigrants from the Azores (16.4%, a difference of 1.6%).
DemographicsRating | RankReceiving Food Stamps
Tsimshian
0.0
/100
|
#296
Tragic
15.7%
Immigrants | Bahamas
0.0
/100
|
#297
Tragic
15.8%
Immigrants | Trinidad and Tobago
0.0
/100
|
#298
Tragic
15.8%
Hispanics or Latinos
0.0
/100
|
#299
Tragic
15.8%
Immigrants | Bangladesh
0.0
/100
|
#300
Tragic
15.9%
Trinidadians and Tobagonians
0.0
/100
|
#301
Tragic
16.0%
Immigrants | West Indies
0.0
/100
|
#302
Tragic
16.1%
Nicaraguans
0.0
/100
|
#303
Tragic
16.1%
West Indians
0.0
/100
|
#304
Tragic
16.3%
Immigrants | Azores
0.0
/100
|
#305
Tragic
16.4%
Jamaicans
0.0
/100
|
#306
Tragic
16.4%
Houma
0.0
/100
|
#307
Tragic
16.5%
Barbadians
0.0
/100
|
#308
Tragic
16.5%
U.S. Virgin Islanders
0.0
/100
|
#309
Tragic
16.5%
Immigrants | Barbados
0.0
/100
|
#310
Tragic
16.6%