Immigrants from Western Europe vs Icelander Married-Couple Family Poverty
COMPARE
Immigrants from Western Europe
Icelander
Married-Couple Family Poverty
Married-Couple Family Poverty Comparison
Immigrants from Western Europe
Icelanders
4.6%
MARRIED-COUPLE FAMILY POVERTY
97.9/ 100
METRIC RATING
100th/ 347
METRIC RANK
4.5%
MARRIED-COUPLE FAMILY POVERTY
99.0/ 100
METRIC RATING
80th/ 347
METRIC RANK
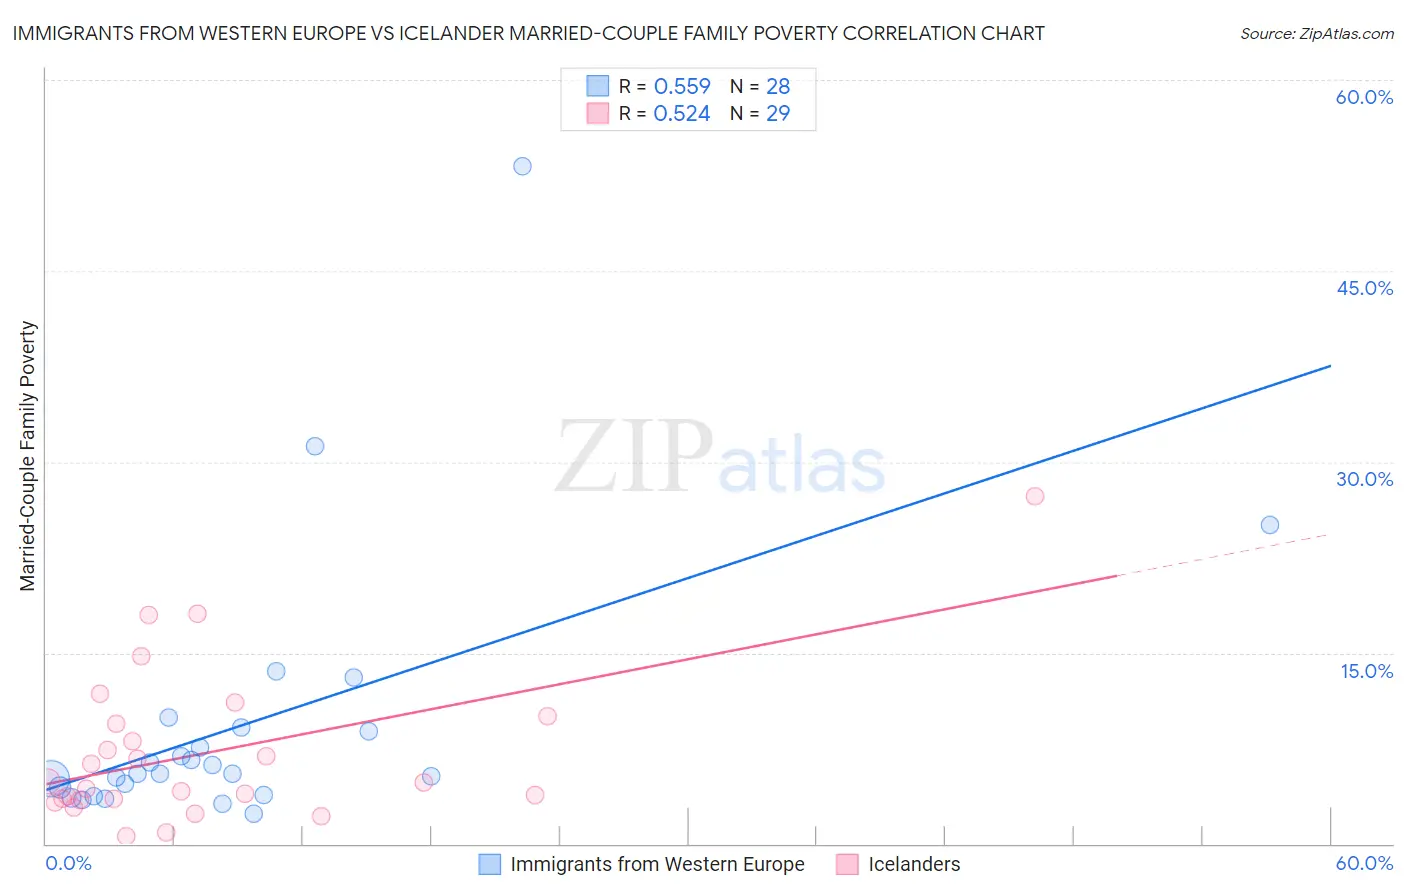
Immigrants from Western Europe vs Icelander Married-Couple Family Poverty Correlation Chart
The statistical analysis conducted on geographies consisting of 486,955,315 people shows a substantial positive correlation between the proportion of Immigrants from Western Europe and poverty level among married-couple families in the United States with a correlation coefficient (R) of 0.559 and weighted average of 4.6%. Similarly, the statistical analysis conducted on geographies consisting of 159,057,565 people shows a substantial positive correlation between the proportion of Icelanders and poverty level among married-couple families in the United States with a correlation coefficient (R) of 0.524 and weighted average of 4.5%, a difference of 2.5%.
Married-Couple Family Poverty Correlation Summary
| Measurement | Immigrants from Western Europe | Icelander |
| Minimum | 2.3% | 0.56% |
| Maximum | 53.2% | 27.3% |
| Range | 50.9% | 26.7% |
| Mean | 9.4% | 7.2% |
| Median | 5.5% | 4.8% |
| Interquartile 25% (IQ1) | 4.1% | 3.4% |
| Interquartile 75% (IQ3) | 9.0% | 9.7% |
| Interquartile Range (IQR) | 4.9% | 6.2% |
| Standard Deviation (Sample) | 10.7% | 6.0% |
| Standard Deviation (Population) | 10.5% | 5.9% |
Demographics Similar to Immigrants from Western Europe and Icelanders by Married-Couple Family Poverty
In terms of married-couple family poverty, the demographic groups most similar to Immigrants from Western Europe are Immigrants from Europe (4.6%, a difference of 0.11%), Native Hawaiian (4.6%, a difference of 0.22%), Immigrants from Belgium (4.6%, a difference of 0.65%), Immigrants from Poland (4.6%, a difference of 0.70%), and Portuguese (4.6%, a difference of 0.78%). Similarly, the demographic groups most similar to Icelanders are Immigrants from Greece (4.5%, a difference of 0.14%), Canadian (4.5%, a difference of 0.39%), Immigrants from Denmark (4.6%, a difference of 0.55%), Immigrants from Croatia (4.6%, a difference of 0.69%), and South African (4.6%, a difference of 0.91%).
| Demographics | Rating | Rank | Married-Couple Family Poverty |
| Icelanders | 99.0 /100 | #80 | Exceptional 4.5% |
| Immigrants | Greece | 98.9 /100 | #81 | Exceptional 4.5% |
| Canadians | 98.8 /100 | #82 | Exceptional 4.5% |
| Immigrants | Denmark | 98.8 /100 | #83 | Exceptional 4.6% |
| Immigrants | Croatia | 98.7 /100 | #84 | Exceptional 4.6% |
| South Africans | 98.7 /100 | #85 | Exceptional 4.6% |
| Immigrants | Turkey | 98.6 /100 | #86 | Exceptional 4.6% |
| Immigrants | North Macedonia | 98.6 /100 | #87 | Exceptional 4.6% |
| Bolivians | 98.6 /100 | #88 | Exceptional 4.6% |
| Immigrants | Czechoslovakia | 98.5 /100 | #89 | Exceptional 4.6% |
| Immigrants | Switzerland | 98.5 /100 | #90 | Exceptional 4.6% |
| Basques | 98.5 /100 | #91 | Exceptional 4.6% |
| Immigrants | Norway | 98.4 /100 | #92 | Exceptional 4.6% |
| Koreans | 98.3 /100 | #93 | Exceptional 4.6% |
| Immigrants | Italy | 98.3 /100 | #94 | Exceptional 4.6% |
| Portuguese | 98.3 /100 | #95 | Exceptional 4.6% |
| Immigrants | Poland | 98.3 /100 | #96 | Exceptional 4.6% |
| Immigrants | Belgium | 98.2 /100 | #97 | Exceptional 4.6% |
| Native Hawaiians | 98.0 /100 | #98 | Exceptional 4.6% |
| Immigrants | Europe | 97.9 /100 | #99 | Exceptional 4.6% |
| Immigrants | Western Europe | 97.9 /100 | #100 | Exceptional 4.6% |