Immigrants from Indonesia vs Irish Receiving Food Stamps
COMPARE
Immigrants from Indonesia
Irish
Receiving Food Stamps
Receiving Food Stamps Comparison
Immigrants from Indonesia
Irish
9.8%
RECEIVING FOOD STAMPS
99.0/ 100
METRIC RATING
67th/ 347
METRIC RANK
10.2%
RECEIVING FOOD STAMPS
97.9/ 100
METRIC RATING
92nd/ 347
METRIC RANK
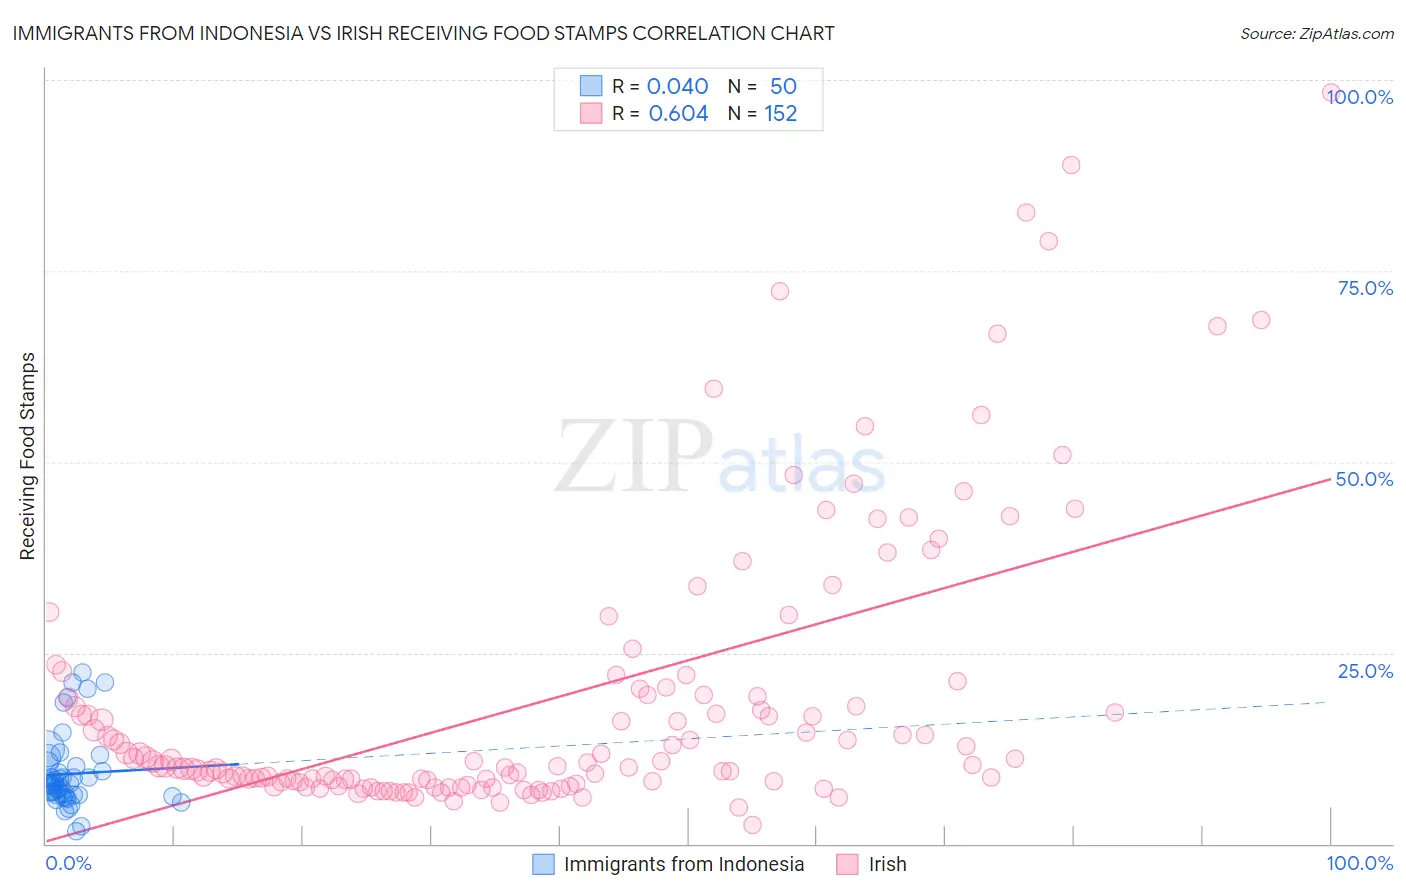
Immigrants from Indonesia vs Irish Receiving Food Stamps Correlation Chart
The statistical analysis conducted on geographies consisting of 215,507,406 people shows no correlation between the proportion of Immigrants from Indonesia and percentage of population receiving government assistance and/or food stamps in the United States with a correlation coefficient (R) of 0.040 and weighted average of 9.8%. Similarly, the statistical analysis conducted on geographies consisting of 576,263,816 people shows a significant positive correlation between the proportion of Irish and percentage of population receiving government assistance and/or food stamps in the United States with a correlation coefficient (R) of 0.604 and weighted average of 10.2%, a difference of 3.4%.
Receiving Food Stamps Correlation Summary
| Measurement | Immigrants from Indonesia | Irish |
| Minimum | 1.6% | 2.5% |
| Maximum | 22.4% | 98.4% |
| Range | 20.8% | 95.9% |
| Mean | 9.2% | 18.8% |
| Median | 7.8% | 10.3% |
| Interquartile 25% (IQ1) | 6.4% | 8.1% |
| Interquartile 75% (IQ3) | 10.1% | 19.4% |
| Interquartile Range (IQR) | 3.7% | 11.3% |
| Standard Deviation (Sample) | 4.8% | 18.6% |
| Standard Deviation (Population) | 4.8% | 18.6% |
Similar Demographics by Receiving Food Stamps
Demographics Similar to Immigrants from Indonesia by Receiving Food Stamps
In terms of receiving food stamps, the demographic groups most similar to Immigrants from Indonesia are Northern European (9.8%, a difference of 0.060%), Slovene (9.8%, a difference of 0.16%), Italian (9.9%, a difference of 0.27%), Immigrants from Serbia (9.9%, a difference of 0.32%), and Immigrants from Turkey (9.8%, a difference of 0.36%).
| Demographics | Rating | Rank | Receiving Food Stamps |
| Germans | 99.2 /100 | #60 | Exceptional 9.7% |
| English | 99.2 /100 | #61 | Exceptional 9.8% |
| Immigrants | Bulgaria | 99.2 /100 | #62 | Exceptional 9.8% |
| Chinese | 99.2 /100 | #63 | Exceptional 9.8% |
| Immigrants | North America | 99.2 /100 | #64 | Exceptional 9.8% |
| Immigrants | Turkey | 99.1 /100 | #65 | Exceptional 9.8% |
| Slovenes | 99.1 /100 | #66 | Exceptional 9.8% |
| Immigrants | Indonesia | 99.0 /100 | #67 | Exceptional 9.8% |
| Northern Europeans | 99.0 /100 | #68 | Exceptional 9.8% |
| Italians | 99.0 /100 | #69 | Exceptional 9.9% |
| Immigrants | Serbia | 99.0 /100 | #70 | Exceptional 9.9% |
| Scottish | 98.9 /100 | #71 | Exceptional 9.9% |
| Immigrants | Asia | 98.9 /100 | #72 | Exceptional 9.9% |
| Macedonians | 98.9 /100 | #73 | Exceptional 9.9% |
| New Zealanders | 98.8 /100 | #74 | Exceptional 9.9% |
Demographics Similar to Irish by Receiving Food Stamps
In terms of receiving food stamps, the demographic groups most similar to Irish are Jordanian (10.2%, a difference of 0.0%), Finnish (10.2%, a difference of 0.040%), Belgian (10.2%, a difference of 0.38%), Immigrants from France (10.1%, a difference of 0.89%), and Immigrants from Greece (10.3%, a difference of 0.91%).
| Demographics | Rating | Rank | Receiving Food Stamps |
| Immigrants | Romania | 98.5 /100 | #85 | Exceptional 10.0% |
| Immigrants | Norway | 98.4 /100 | #86 | Exceptional 10.0% |
| Egyptians | 98.4 /100 | #87 | Exceptional 10.0% |
| Immigrants | Kuwait | 98.4 /100 | #88 | Exceptional 10.0% |
| Immigrants | France | 98.3 /100 | #89 | Exceptional 10.1% |
| Finns | 97.9 /100 | #90 | Exceptional 10.2% |
| Jordanians | 97.9 /100 | #91 | Exceptional 10.2% |
| Irish | 97.9 /100 | #92 | Exceptional 10.2% |
| Belgians | 97.7 /100 | #93 | Exceptional 10.2% |
| Immigrants | Greece | 97.4 /100 | #94 | Exceptional 10.3% |
| Basques | 97.4 /100 | #95 | Exceptional 10.3% |
| Welsh | 97.3 /100 | #96 | Exceptional 10.3% |
| Czechoslovakians | 97.2 /100 | #97 | Exceptional 10.3% |
| Immigrants | Egypt | 97.1 /100 | #98 | Exceptional 10.3% |
| Serbians | 97.0 /100 | #99 | Exceptional 10.3% |