Immigrants from England vs Cajun Single Female Poverty

COMPARE

Immigrants from England
Race
Ancestry
AfghanAfricanAlaska NativeAlaskan AthabascanAlbanianAleutAlsatianAmericanApacheArabArapahoArgentineanArmenianAssyrian/Chaldean/SyriacAustralianAustrianBahamianBangladeshiBarbadianBasqueBelgianBelizeanBermudanBhutaneseBlackfeetBolivianBrazilianBritishBritish West IndianBulgarianBurmeseCambodianCanadianCape VerdeanCarpatho RusynCelticCentral AmericanCentral American IndianCherokeeCheyenneChickasawChileanChineseChippewaChoctawColombianColvilleComancheCosta RicanCreeCreekCroatianCrowCubanCypriotCzechCzechoslovakianDanishDelawareDominicanDutchDutch West IndianEastern EuropeanEcuadorianEgyptianEnglishEstonianEthiopianEuropeanFijianFilipinoFinnishFrenchFrench American IndianFrench CanadianGermanGerman RussianGhanaianGreekGuamanian/ChamorroGuatemalanGuyaneseHaitianHmongHonduranHopiHoumaHungarianIcelanderIndian (Asian)IndonesianInupiatIranianIraqiIrishIroquoisIsraeliItalianJamaicanJapaneseJordanianKenyanKiowaKoreanLaotianLatvianLebaneseLiberianLithuanianLumbeeLuxembourgerMacedonianMalaysianMalteseMarshalleseMenomineeMexicanMexican American IndianMongolianMoroccanNative HawaiianNavajoNepaleseNew ZealanderNicaraguanNigerianNorthern EuropeanNorwegianOkinawanOsageOttawaPaiutePakistaniPalestinianPanamanianParaguayanPennsylvania GermanPeruvianPimaPolishPortuguesePotawatomiPuebloPuerto RicanPuget Sound SalishRomanianRussianSalvadoranSamoanScandinavianScotch-IrishScottishSeminoleSenegaleseSerbianShoshoneSierra LeoneanSiouxSlavicSlovakSloveneSomaliSouth AfricanSouth AmericanSouth American IndianSoviet UnionSpaniardSpanishSpanish AmericanSpanish American IndianSri LankanSubsaharan AfricanSudaneseSwedishSwissSyrianTaiwaneseThaiTlingit-HaidaTohono O'OdhamTonganTrinidadian and TobagonianTsimshianTurkishU.S. Virgin IslanderUgandanUkrainianUruguayanUteVenezuelanVietnameseWelshWest IndianYakamaYaquiYugoslavianYumanYup'ikZimbabwean
Immigration
NonimmigrantsImmigrantsAfghanistanAfricaAlbaniaArgentinaArmeniaAsiaAustraliaAustriaBahamasBangladeshBarbadosBelarusBelgiumBelizeBoliviaBosnia and HerzegovinaBrazilBulgariaBurma/MyanmarCabo VerdeCambodiaCameroonCanadaCaribbeanCentral AmericaChileChinaColombiaCongoCosta RicaCroatiaCubaCzechoslovakiaDenmarkDominicaDominican RepublicEastern AfricaEastern AsiaEastern EuropeEcuadorEgyptEl SalvadorEnglandEritreaEthiopiaEuropeFijiFranceGermanyGhanaGreeceGrenadaGuatemalaGuyanaHaitiHondurasHong KongHungaryIndiaIndonesiaIranIraqIrelandIsraelItalyJamaicaJapanJordanKazakhstanKenyaKoreaKuwaitLaosLatin AmericaLatviaLebanonLiberiaLithuaniaMalaysiaMexicoMicronesiaMiddle AfricaMoldovaMoroccoNepalNetherlandsNicaraguaNigeriaNorth AmericaNorth MacedoniaNorthern AfricaNorthern EuropeNorwayOceaniaPakistanPanamaPeruPhilippinesPolandPortugalRomaniaRussiaSaudi ArabiaScotlandSenegalSerbiaSierra LeoneSingaporeSomaliaSouth AfricaSouth AmericaSouth Central AsiaSouth Eastern AsiaSouthern EuropeSpainSri LankaSt. Vincent and the GrenadinesSudanSwedenSwitzerlandSyriaTaiwanThailandTrinidad and TobagoTurkeyUgandaUkraineUruguayUzbekistanVenezuelaVietnamWest IndiesWestern AfricaWestern AsiaWestern EuropeYemenZaireZimbabweAzores
Cajun
Race
Ancestry
AfghanAfricanAlaska NativeAlaskan AthabascanAlbanianAleutAlsatianAmericanApacheArabArapahoArgentineanArmenianAssyrian/Chaldean/SyriacAustralianAustrianBahamianBangladeshiBarbadianBasqueBelgianBelizeanBermudanBhutaneseBlackfeetBolivianBrazilianBritishBritish West IndianBulgarianBurmeseCajunCambodianCanadianCape VerdeanCarpatho RusynCelticCentral AmericanCentral American IndianCherokeeCheyenneChickasawChileanChineseChippewaChoctawColombianColvilleComancheCosta RicanCreeCreekCroatianCrowCubanCypriotCzechCzechoslovakianDanishDelawareDominicanDutchDutch West IndianEastern EuropeanEcuadorianEgyptianEnglishEstonianEthiopianEuropeanFijianFilipinoFinnishFrenchFrench American IndianFrench CanadianGermanGerman RussianGhanaianGreekGuamanian/ChamorroGuatemalanGuyaneseHaitianHmongHonduranHopiHoumaHungarianIcelanderIndian (Asian)IndonesianInupiatIranianIraqiIrishIroquoisIsraeliItalianJamaicanJapaneseJordanianKenyanKiowaKoreanLaotianLatvianLebaneseLiberianLithuanianLumbeeLuxembourgerMacedonianMalaysianMalteseMarshalleseMenomineeMexicanMexican American IndianMongolianMoroccanNative HawaiianNavajoNepaleseNew ZealanderNicaraguanNigerianNorthern EuropeanNorwegianOkinawanOsageOttawaPaiutePakistaniPalestinianPanamanianParaguayanPennsylvania GermanPeruvianPimaPolishPortuguesePotawatomiPuebloPuerto RicanPuget Sound SalishRomanianRussianSalvadoranSamoanScandinavianScotch-IrishScottishSeminoleSenegaleseSerbianShoshoneSierra LeoneanSiouxSlavicSlovakSloveneSomaliSouth AfricanSouth AmericanSouth American IndianSoviet UnionSpaniardSpanishSpanish AmericanSpanish American IndianSri LankanSubsaharan AfricanSudaneseSwedishSwissSyrianTaiwaneseThaiTlingit-HaidaTohono O'OdhamTonganTrinidadian and TobagonianTsimshianTurkishU.S. Virgin IslanderUgandanUkrainianUruguayanUteVenezuelanVietnameseWelshWest IndianYakamaYaquiYugoslavianYumanYup'ikZimbabwean
Immigration
NonimmigrantsImmigrantsAfghanistanAfricaAlbaniaArgentinaArmeniaAsiaAustraliaAustriaBahamasBangladeshBarbadosBelarusBelgiumBelizeBoliviaBosnia and HerzegovinaBrazilBulgariaBurma/MyanmarCabo VerdeCambodiaCameroonCanadaCaribbeanCentral AmericaChileChinaColombiaCongoCosta RicaCroatiaCubaCzechoslovakiaDenmarkDominicaDominican RepublicEastern AfricaEastern AsiaEastern EuropeEcuadorEgyptEl SalvadorEritreaEthiopiaEuropeFijiFranceGermanyGhanaGreeceGrenadaGuatemalaGuyanaHaitiHondurasHong KongHungaryIndiaIndonesiaIranIraqIrelandIsraelItalyJamaicaJapanJordanKazakhstanKenyaKoreaKuwaitLaosLatin AmericaLatviaLebanonLiberiaLithuaniaMalaysiaMexicoMicronesiaMiddle AfricaMoldovaMoroccoNepalNetherlandsNicaraguaNigeriaNorth AmericaNorth MacedoniaNorthern AfricaNorthern EuropeNorwayOceaniaPakistanPanamaPeruPhilippinesPolandPortugalRomaniaRussiaSaudi ArabiaScotlandSenegalSerbiaSierra LeoneSingaporeSomaliaSouth AfricaSouth AmericaSouth Central AsiaSouth Eastern AsiaSouthern EuropeSpainSri LankaSt. Vincent and the GrenadinesSudanSwedenSwitzerlandSyriaTaiwanThailandTrinidad and TobagoTurkeyUgandaUkraineUruguayUzbekistanVenezuelaVietnamWest IndiesWestern AfricaWestern AsiaWestern EuropeYemenZaireZimbabweAzores
Single Female Poverty
Income
Poverty
Unemployment
Labor Participation
Family Structure
Vehicle Availability
Education Level
Disability

Single Female Poverty Comparison

Immigrants from England

Cajuns

Exceptional
Tragic
20.2%
SINGLE FEMALE POVERTY
91.9/ 100
METRIC RATING
133rd/ 347
METRIC RANK
30.6%
SINGLE FEMALE POVERTY
0.0/ 100
METRIC RATING
340th/ 347
METRIC RANK

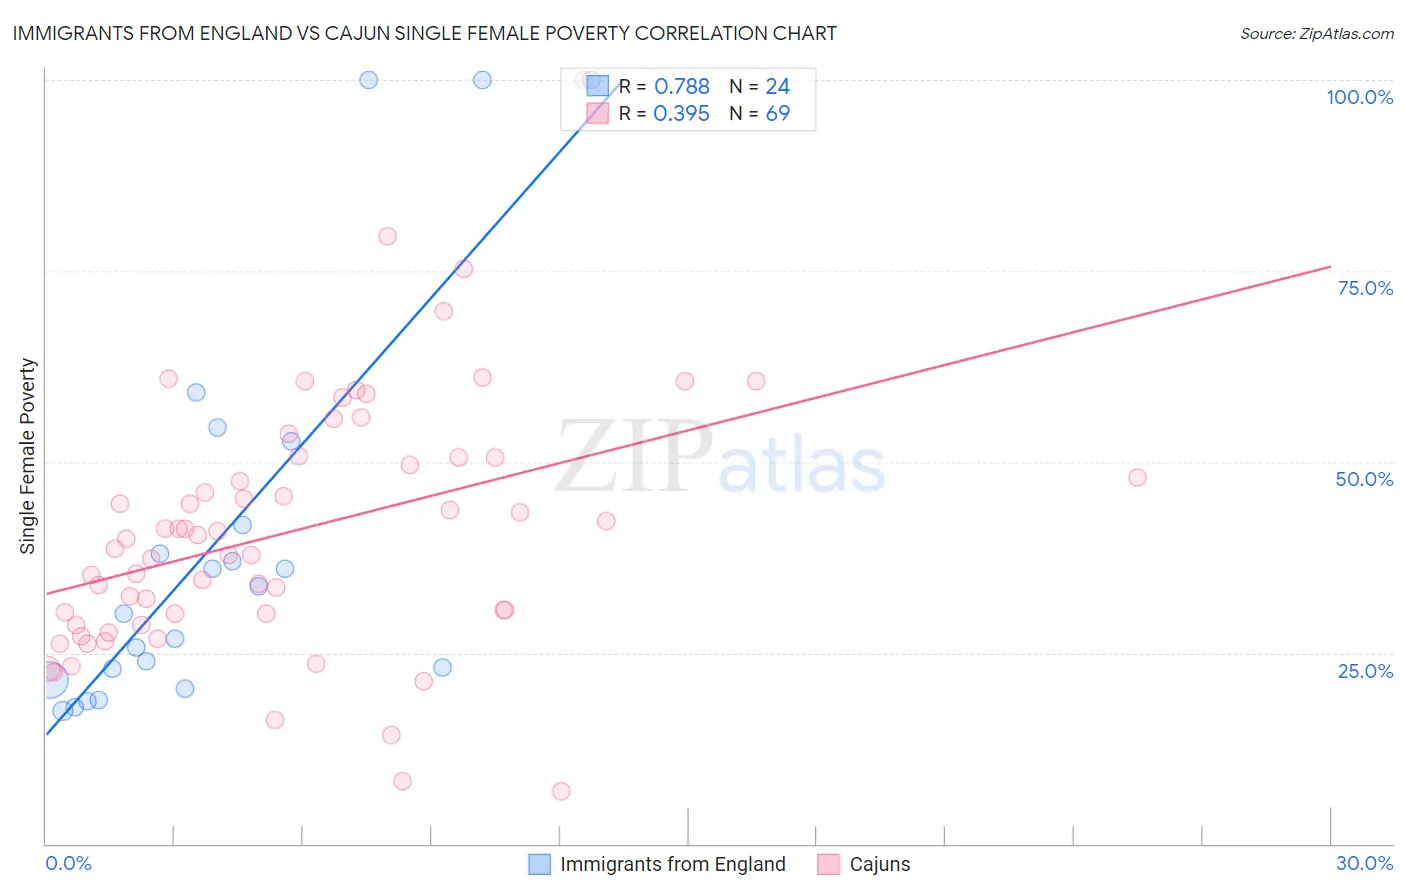
Immigrants from England vs Cajun Single Female Poverty Correlation Chart

The statistical analysis conducted on geographies consisting of 384,642,935 people shows a strong positive correlation between the proportion of Immigrants from England and poverty level among single females in the United States with a correlation coefficient (R) of 0.788 and weighted average of 20.2%. Similarly, the statistical analysis conducted on geographies consisting of 148,582,163 people shows a mild positive correlation between the proportion of Cajuns and poverty level among single females in the United States with a correlation coefficient (R) of 0.395 and weighted average of 30.6%, a difference of 51.6%.
Immigrants from England vs Cajun Single Female Poverty

Single Female Poverty Correlation Summary

MeasurementImmigrants from EnglandCajun
Minimum17.4%6.8%
Maximum100.0%100.0%
Range82.6%93.2%
Mean39.8%40.8%
Median32.0%39.9%
Interquartile 25% (IQ1)22.2%29.3%
Interquartile 75% (IQ3)47.2%50.5%
Interquartile Range (IQR)25.0%21.2%
Standard Deviation (Sample)26.0%16.6%
Standard Deviation (Population)25.5%16.5%

Similar Demographics by Single Female Poverty

Demographics Similar to Immigrants from England by Single Female Poverty

In terms of single female poverty, the demographic groups most similar to Immigrants from England are Pakistani (20.2%, a difference of 0.030%), Uruguayan (20.2%, a difference of 0.030%), Immigrants from Hungary (20.2%, a difference of 0.090%), Immigrants from Venezuela (20.2%, a difference of 0.090%), and Immigrants from Morocco (20.2%, a difference of 0.11%).
DemographicsRating | RankSingle Female Poverty
Serbians
93.3
/100
|
#126
Exceptional
20.1%
Mongolians
93.2
/100
|
#127
Exceptional
20.2%
Immigrants | Spain
92.7
/100
|
#128
Exceptional
20.2%
Immigrants | Morocco
92.4
/100
|
#129
Exceptional
20.2%
Immigrants | Hungary
92.3
/100
|
#130
Exceptional
20.2%
Pakistanis
92.1
/100
|
#131
Exceptional
20.2%
Uruguayans
92.1
/100
|
#132
Exceptional
20.2%
Immigrants | England
91.9
/100
|
#133
Exceptional
20.2%
Immigrants | Venezuela
91.5
/100
|
#134
Exceptional
20.2%
Immigrants | Iraq
91.2
/100
|
#135
Exceptional
20.2%
Immigrants | Canada
91.2
/100
|
#136
Exceptional
20.2%
Immigrants | Nepal
90.6
/100
|
#137
Exceptional
20.3%
Slovenes
90.5
/100
|
#138
Exceptional
20.3%
Immigrants | Kuwait
90.4
/100
|
#139
Exceptional
20.3%
Syrians
90.4
/100
|
#140
Exceptional
20.3%

Demographics Similar to Cajuns by Single Female Poverty

In terms of single female poverty, the demographic groups most similar to Cajuns are Cheyenne (30.4%, a difference of 0.81%), Pima (30.3%, a difference of 1.0%), Sioux (31.3%, a difference of 2.0%), Navajo (31.7%, a difference of 3.3%), and Yuman (29.4%, a difference of 4.1%).
DemographicsRating | RankSingle Female Poverty
Ute
0.0
/100
|
#333
Tragic
28.4%
Pueblo
0.0
/100
|
#334
Tragic
28.6%
Immigrants | Yemen
0.0
/100
|
#335
Tragic
28.9%
Colville
0.0
/100
|
#336
Tragic
29.1%
Yuman
0.0
/100
|
#337
Tragic
29.4%
Pima
0.0
/100
|
#338
Tragic
30.3%
Cheyenne
0.0
/100
|
#339
Tragic
30.4%
Cajuns
0.0
/100
|
#340
Tragic
30.6%
Sioux
0.0
/100
|
#341
Tragic
31.3%
Navajo
0.0
/100
|
#342
Tragic
31.7%
Crow
0.0
/100
|
#343
Tragic
32.4%
Lumbee
0.0
/100
|
#344
Tragic
33.0%
Houma
0.0
/100
|
#345
Tragic
33.8%
Puerto Ricans
0.0
/100
|
#346
Tragic
34.1%
Tohono O'odham
0.0
/100
|
#347
Tragic
34.2%