Immigrants from Caribbean vs Jordanian Seniors Poverty Over the Age of 75

COMPARE

Immigrants from Caribbean
Race
Ancestry
AfghanAfricanAlaska NativeAlaskan AthabascanAlbanianAleutAlsatianAmericanApacheArabArapahoArgentineanArmenianAssyrian/Chaldean/SyriacAustralianAustrianBahamianBangladeshiBarbadianBasqueBelgianBelizeanBermudanBhutaneseBlackfeetBolivianBrazilianBritishBritish West IndianBulgarianBurmeseCajunCambodianCanadianCape VerdeanCarpatho RusynCelticCentral AmericanCentral American IndianCherokeeCheyenneChickasawChileanChineseChippewaChoctawColombianColvilleComancheCosta RicanCreeCreekCroatianCrowCubanCypriotCzechCzechoslovakianDanishDelawareDominicanDutchDutch West IndianEastern EuropeanEcuadorianEgyptianEnglishEstonianEthiopianEuropeanFijianFilipinoFinnishFrenchFrench American IndianFrench CanadianGermanGerman RussianGhanaianGreekGuamanian/ChamorroGuatemalanGuyaneseHaitianHmongHonduranHopiHoumaHungarianIcelanderIndian (Asian)IndonesianInupiatIranianIraqiIrishIroquoisIsraeliItalianJamaicanJapaneseKenyanKiowaKoreanLaotianLatvianLebaneseLiberianLithuanianLumbeeLuxembourgerMacedonianMalaysianMalteseMarshalleseMenomineeMexicanMexican American IndianMongolianMoroccanNative HawaiianNavajoNepaleseNew ZealanderNicaraguanNigerianNorthern EuropeanNorwegianOkinawanOsageOttawaPaiutePakistaniPalestinianPanamanianParaguayanPennsylvania GermanPeruvianPimaPolishPortuguesePotawatomiPuebloPuerto RicanPuget Sound SalishRomanianRussianSalvadoranSamoanScandinavianScotch-IrishScottishSeminoleSenegaleseSerbianShoshoneSierra LeoneanSiouxSlavicSlovakSloveneSomaliSouth AfricanSouth AmericanSouth American IndianSoviet UnionSpaniardSpanishSpanish AmericanSpanish American IndianSri LankanSubsaharan AfricanSudaneseSwedishSwissSyrianTaiwaneseThaiTlingit-HaidaTohono O'OdhamTonganTrinidadian and TobagonianTsimshianTurkishU.S. Virgin IslanderUgandanUkrainianUruguayanUteVenezuelanVietnameseWelshWest IndianYakamaYaquiYugoslavianYumanYup'ikZimbabwean
Immigration
NonimmigrantsImmigrantsAfghanistanAfricaAlbaniaArgentinaArmeniaAsiaAustraliaAustriaBahamasBangladeshBarbadosBelarusBelgiumBelizeBoliviaBosnia and HerzegovinaBrazilBulgariaBurma/MyanmarCabo VerdeCambodiaCameroonCanadaCaribbeanCentral AmericaChileChinaColombiaCongoCosta RicaCroatiaCubaCzechoslovakiaDenmarkDominicaDominican RepublicEastern AfricaEastern AsiaEastern EuropeEcuadorEgyptEl SalvadorEnglandEritreaEthiopiaEuropeFijiFranceGermanyGhanaGreeceGrenadaGuatemalaGuyanaHaitiHondurasHong KongHungaryIndiaIndonesiaIranIraqIrelandIsraelItalyJamaicaJapanJordanKazakhstanKenyaKoreaKuwaitLaosLatin AmericaLatviaLebanonLiberiaLithuaniaMalaysiaMexicoMicronesiaMiddle AfricaMoldovaMoroccoNepalNetherlandsNicaraguaNigeriaNorth AmericaNorth MacedoniaNorthern AfricaNorthern EuropeNorwayOceaniaPakistanPanamaPeruPhilippinesPolandPortugalRomaniaRussiaSaudi ArabiaScotlandSenegalSerbiaSierra LeoneSingaporeSomaliaSouth AfricaSouth AmericaSouth Central AsiaSouth Eastern AsiaSouthern EuropeSpainSri LankaSt. Vincent and the GrenadinesSudanSwedenSwitzerlandSyriaTaiwanThailandTrinidad and TobagoTurkeyUgandaUkraineUruguayUzbekistanVenezuelaVietnamWest IndiesWestern AfricaWestern AsiaWestern EuropeYemenZaireZimbabweAzores
Jordanian
Race
Ancestry
AfghanAfricanAlaska NativeAlaskan AthabascanAlbanianAleutAlsatianAmericanApacheArabArapahoArgentineanArmenianAssyrian/Chaldean/SyriacAustralianAustrianBahamianBangladeshiBarbadianBasqueBelgianBelizeanBermudanBhutaneseBlackfeetBolivianBrazilianBritishBritish West IndianBulgarianBurmeseCajunCambodianCanadianCape VerdeanCarpatho RusynCelticCentral AmericanCentral American IndianCherokeeCheyenneChickasawChileanChineseChippewaChoctawColombianColvilleComancheCosta RicanCreeCreekCroatianCrowCubanCypriotCzechCzechoslovakianDanishDelawareDominicanDutchDutch West IndianEastern EuropeanEcuadorianEgyptianEnglishEstonianEthiopianEuropeanFijianFilipinoFinnishFrenchFrench American IndianFrench CanadianGermanGerman RussianGhanaianGreekGuamanian/ChamorroGuatemalanGuyaneseHaitianHmongHonduranHopiHoumaHungarianIcelanderIndian (Asian)IndonesianInupiatIranianIraqiIrishIroquoisIsraeliItalianJamaicanJapaneseJordanianKenyanKiowaKoreanLaotianLatvianLebaneseLiberianLithuanianLumbeeLuxembourgerMacedonianMalaysianMalteseMarshalleseMenomineeMexicanMexican American IndianMongolianMoroccanNative HawaiianNavajoNepaleseNew ZealanderNicaraguanNigerianNorthern EuropeanNorwegianOkinawanOsageOttawaPaiutePakistaniPalestinianPanamanianParaguayanPennsylvania GermanPeruvianPimaPolishPortuguesePotawatomiPuebloPuerto RicanPuget Sound SalishRomanianRussianSalvadoranSamoanScandinavianScotch-IrishScottishSeminoleSenegaleseSerbianShoshoneSierra LeoneanSiouxSlavicSlovakSloveneSomaliSouth AfricanSouth AmericanSouth American IndianSoviet UnionSpaniardSpanishSpanish AmericanSpanish American IndianSri LankanSubsaharan AfricanSudaneseSwedishSwissSyrianTaiwaneseThaiTlingit-HaidaTohono O'OdhamTonganTrinidadian and TobagonianTsimshianTurkishU.S. Virgin IslanderUgandanUkrainianUruguayanUteVenezuelanVietnameseWelshWest IndianYakamaYaquiYugoslavianYumanYup'ikZimbabwean
Immigration
NonimmigrantsImmigrantsAfghanistanAfricaAlbaniaArgentinaArmeniaAsiaAustraliaAustriaBahamasBangladeshBarbadosBelarusBelgiumBelizeBoliviaBosnia and HerzegovinaBrazilBulgariaBurma/MyanmarCabo VerdeCambodiaCameroonCanadaCentral AmericaChileChinaColombiaCongoCosta RicaCroatiaCubaCzechoslovakiaDenmarkDominicaDominican RepublicEastern AfricaEastern AsiaEastern EuropeEcuadorEgyptEl SalvadorEnglandEritreaEthiopiaEuropeFijiFranceGermanyGhanaGreeceGrenadaGuatemalaGuyanaHaitiHondurasHong KongHungaryIndiaIndonesiaIranIraqIrelandIsraelItalyJamaicaJapanJordanKazakhstanKenyaKoreaKuwaitLaosLatin AmericaLatviaLebanonLiberiaLithuaniaMalaysiaMexicoMicronesiaMiddle AfricaMoldovaMoroccoNepalNetherlandsNicaraguaNigeriaNorth AmericaNorth MacedoniaNorthern AfricaNorthern EuropeNorwayOceaniaPakistanPanamaPeruPhilippinesPolandPortugalRomaniaRussiaSaudi ArabiaScotlandSenegalSerbiaSierra LeoneSingaporeSomaliaSouth AfricaSouth AmericaSouth Central AsiaSouth Eastern AsiaSouthern EuropeSpainSri LankaSt. Vincent and the GrenadinesSudanSwedenSwitzerlandSyriaTaiwanThailandTrinidad and TobagoTurkeyUgandaUkraineUruguayUzbekistanVenezuelaVietnamWest IndiesWestern AfricaWestern AsiaWestern EuropeYemenZaireZimbabweAzores
Seniors Poverty Over the Age of 75
Income
Poverty
Unemployment
Labor Participation
Family Structure
Vehicle Availability
Education Level
Disability

Seniors Poverty Over the Age of 75 Comparison

Immigrants from Caribbean

Jordanians

Tragic
Exceptional
18.2%
SENIORS POVERTY OVER THE AGE OF 75
0.0/ 100
METRIC RATING
336th/ 347
METRIC RANK
11.6%
SENIORS POVERTY OVER THE AGE OF 75
90.8/ 100
METRIC RATING
101st/ 347
METRIC RANK

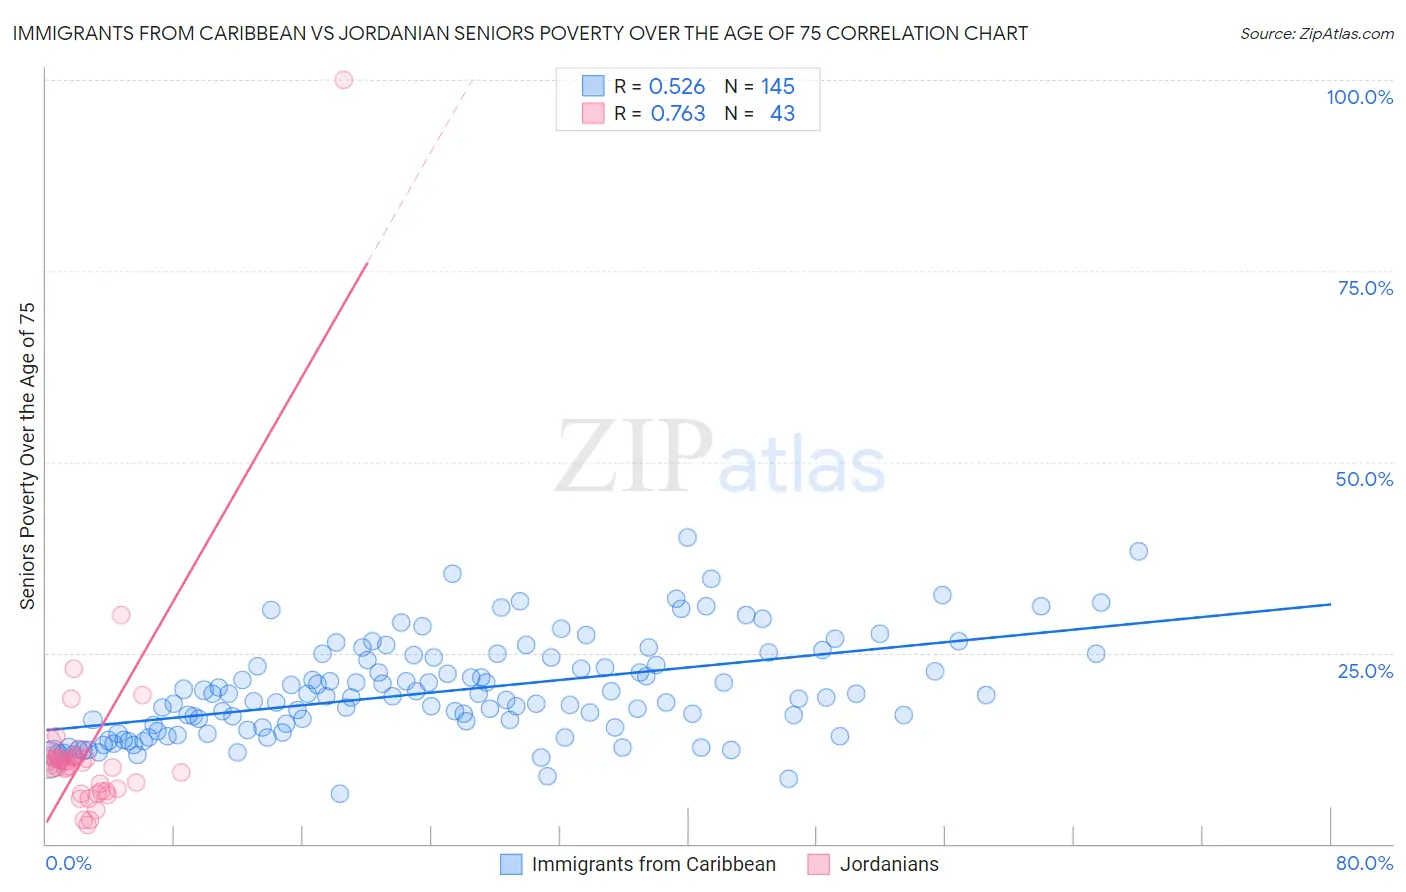
Immigrants from Caribbean vs Jordanian Seniors Poverty Over the Age of 75 Correlation Chart

The statistical analysis conducted on geographies consisting of 443,355,794 people shows a substantial positive correlation between the proportion of Immigrants from Caribbean and poverty level among seniors over the age of 75 in the United States with a correlation coefficient (R) of 0.526 and weighted average of 18.2%. Similarly, the statistical analysis conducted on geographies consisting of 165,896,130 people shows a strong positive correlation between the proportion of Jordanians and poverty level among seniors over the age of 75 in the United States with a correlation coefficient (R) of 0.763 and weighted average of 11.6%, a difference of 57.0%.
Immigrants from Caribbean vs Jordanian Seniors Poverty Over the Age of 75

Seniors Poverty Over the Age of 75 Correlation Summary

MeasurementImmigrants from CaribbeanJordanian
Minimum6.6%2.4%
Maximum40.1%100.0%
Range33.5%97.6%
Mean19.9%12.5%
Median19.2%10.4%
Interquartile 25% (IQ1)14.8%6.9%
Interquartile 75% (IQ3)24.2%11.3%
Interquartile Range (IQR)9.4%4.4%
Standard Deviation (Sample)6.4%14.6%
Standard Deviation (Population)6.4%14.4%

Similar Demographics by Seniors Poverty Over the Age of 75

Demographics Similar to Immigrants from Caribbean by Seniors Poverty Over the Age of 75

In terms of seniors poverty over the age of 75, the demographic groups most similar to Immigrants from Caribbean are Yakama (18.3%, a difference of 0.40%), Immigrants from Cabo Verde (18.5%, a difference of 1.4%), Cuban (18.0%, a difference of 1.6%), Immigrants from Grenada (17.8%, a difference of 2.2%), and Hopi (18.9%, a difference of 3.4%).
DemographicsRating | RankSeniors Poverty Over the Age of 75
Immigrants | Dominica
0.0
/100
|
#329
Tragic
17.0%
British West Indians
0.0
/100
|
#330
Tragic
17.4%
Immigrants | Armenia
0.0
/100
|
#331
Tragic
17.5%
Immigrants | St. Vincent and the Grenadines
0.0
/100
|
#332
Tragic
17.5%
Immigrants | Nicaragua
0.0
/100
|
#333
Tragic
17.6%
Immigrants | Grenada
0.0
/100
|
#334
Tragic
17.8%
Cubans
0.0
/100
|
#335
Tragic
18.0%
Immigrants | Caribbean
0.0
/100
|
#336
Tragic
18.2%
Yakama
0.0
/100
|
#337
Tragic
18.3%
Immigrants | Cabo Verde
0.0
/100
|
#338
Tragic
18.5%
Hopi
0.0
/100
|
#339
Tragic
18.9%
Tohono O'odham
0.0
/100
|
#340
Tragic
19.1%
Navajo
0.0
/100
|
#341
Tragic
19.4%
Dominicans
0.0
/100
|
#342
Tragic
19.6%
Lumbee
0.0
/100
|
#343
Tragic
19.7%

Demographics Similar to Jordanians by Seniors Poverty Over the Age of 75

In terms of seniors poverty over the age of 75, the demographic groups most similar to Jordanians are Guamanian/Chamorro (11.6%, a difference of 0.040%), Syrian (11.6%, a difference of 0.080%), Immigrants from Kuwait (11.6%, a difference of 0.080%), Immigrants from Singapore (11.6%, a difference of 0.13%), and Chickasaw (11.6%, a difference of 0.14%).
DemographicsRating | RankSeniors Poverty Over the Age of 75
Creek
92.7
/100
|
#94
Exceptional
11.6%
Immigrants | Bosnia and Herzegovina
92.6
/100
|
#95
Exceptional
11.6%
Immigrants | Sweden
92.6
/100
|
#96
Exceptional
11.6%
Romanians
92.3
/100
|
#97
Exceptional
11.6%
Immigrants | Japan
91.9
/100
|
#98
Exceptional
11.6%
Immigrants | Ethiopia
91.7
/100
|
#99
Exceptional
11.6%
Syrians
91.1
/100
|
#100
Exceptional
11.6%
Jordanians
90.8
/100
|
#101
Exceptional
11.6%
Guamanians/Chamorros
90.6
/100
|
#102
Exceptional
11.6%
Immigrants | Kuwait
90.5
/100
|
#103
Exceptional
11.6%
Immigrants | Singapore
90.3
/100
|
#104
Exceptional
11.6%
Chickasaw
90.2
/100
|
#105
Exceptional
11.6%
Russians
89.9
/100
|
#106
Excellent
11.6%
Immigrants | Oceania
89.4
/100
|
#107
Excellent
11.7%
Turks
89.4
/100
|
#108
Excellent
11.7%